Top 15 Python Libraries for Data Science in 2017
As Python has gained a lot of traction in the recent years in Data Science industry, I wanted to outline some of its most useful libraries for data scientists and engineers, based on recent experience.
And, since all of the libraries are open sourced, we have added commits, contributors count and other metrics from Github, which could be served as a proxy metrics for library popularity.
Core Libraries.
1. NumPy (Commits: 15980, Contributors: 522)
When starting to deal with the scientific task in Python, one inevitably comes for help to Python’s SciPy Stack, which is a collection of software specifically designed for scientific computing in Python (do not confuse with SciPy library, which is part of this stack, and the community around this stack). This way we want to start with a look at it. However, the stack is pretty vast, there is more than a dozen of libraries in it, and we want to put a focal point on the core packages (particularly the most essential ones).
The most fundamental package, around which the scientific computation stack is built, is NumPy (stands for Numerical Python). It provides an abundance of useful features for operations on n-arrays and matrices in Python. The library provides vectorization of mathematical operations on the NumPy array type, which ameliorates performance and accordingly speeds up the execution.
2. SciPy (Commits: 17213, Contributors: 489)
SciPy is a library of software for engineering and science. Again you need to understand the difference between SciPy Stack and SciPy Library. SciPy contains modules for linear algebra, optimization, integration, and statistics. The main functionality of SciPy library is built upon NumPy, and its arrays thus make substantial use of NumPy. It provides efficient numerical routines as numerical integration, optimization, and many others via its specific submodules. The functions in all submodules of SciPy are well documented — another coin in its pot.
3. Pandas (Commits: 15089, Contributors: 762)
Pandas is a Python package designed to do work with “labeled” and “relational” data simple and intuitive. Pandas is a perfect tool for data wrangling. It designed for quick and easy data manipulation, aggregation, and visualization.
There are two main data structures in the library:
“Series” — one-dimensional
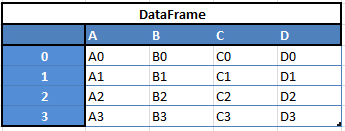
“Data Frames”, two-dimensional
For example, when you want to receive a new Dataframe from these two types of structures, as a result you will receive such DF by appending a single row to a DataFrame by passing a Series:
Here is just a small list of things that you can do with Pandas:
- Easily delete and add columns from DataFrame
- Convert data structures to DataFrame objects
- Handle missing data, represents as NaNs
- Powerful grouping by functionality
Google Trends history
trends.google.com
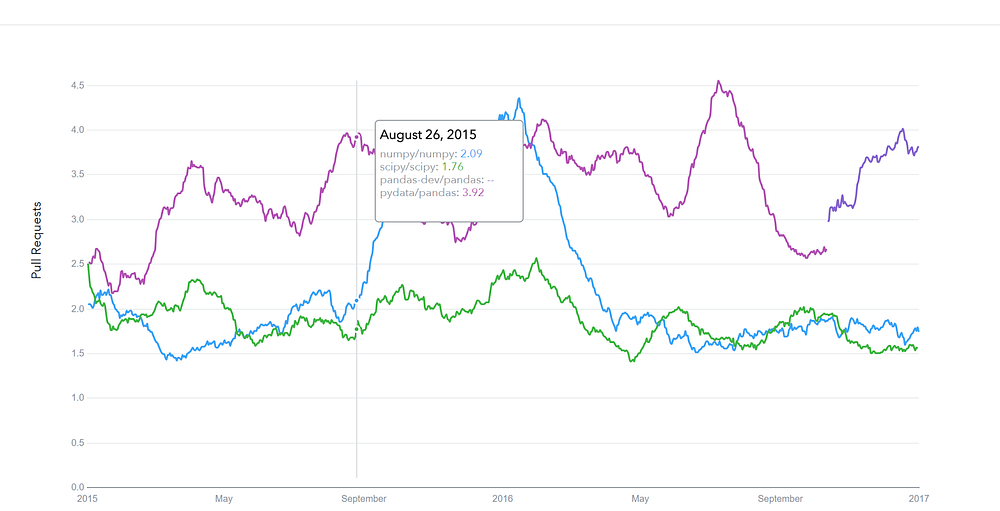
GitHub pull requests history
datascience.com/trends
Visualization.
4.Matplotlib (Commits: 21754, Contributors: 588)
Another SciPy Stack core package and another Python Library that is tailored for the generation of simple and powerful visualizations with ease is Matplotlib. It is a top-notch piece of software which is making Python (with some help of NumPy, SciPy, and Pandas) a cognizant competitor to such scientific tools as MatLab or Mathematica.
However, the library is pretty low-level, meaning that you will need to write more code to reach the advanced levels of visualizations and you will generally put more effort, than if using more high-level tools, but the overall effort is worth a shot.
With a bit of effort you can make just about any visualizations:
- Line plots;
- Scatter plots;
- Bar charts and Histograms;
- Pie charts;
- Stem plots;
- Contour plots;
- Quiver plots;
- Spectrograms.
There are also facilities for creating labels, grids, legends, and many other formatting entities with Matplotlib. Basically, everything is customizable.
The library is supported by different platforms and makes use of different GUI kits for the depiction of resulting visualizations. Varying IDEs (like IPython) support functionality of Matplotlib.
There are also some additional libraries that can make visualization even easier.
5. Seaborn (Commits: 1699, Contributors: 71)
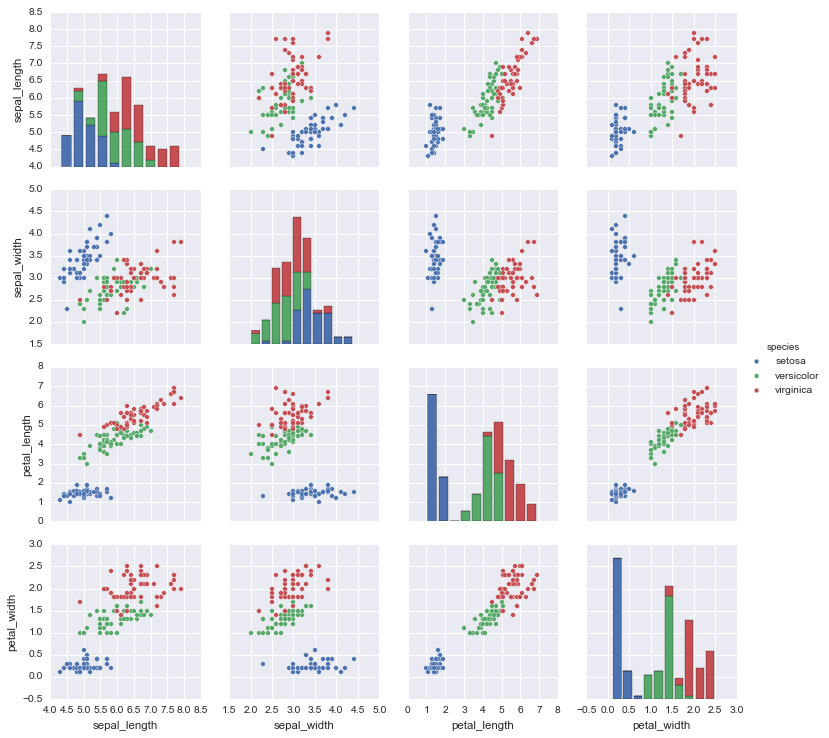
Seaborn is mostly focused on the visualization of statistical models; such visualizations include heat maps, those that summarize the data but still depict the overall distributions. Seaborn is based on Matplotlib and highly dependent on that.
6. Bokeh (Commits: 15724, Contributors: 223)
Another great visualization library is Bokeh, which is aimed at interactive visualizations. In contrast to the previous library, this one is independent of Matplotlib. The main focus of Bokeh, as we already mentioned, is interactivity and it makes its presentation via modern browsers in the style of Data-Driven Documents (d3.js).
7. Plotly (Commits: 2486, Contributors: 33)
Finally, a word about Plotly. It is rather a web-based toolbox for building visualizations, exposing APIs to some programming languages (Python among them). There is a number of robust, out-of-box graphics on the plot.ly website. In order to use Plotly, you will need to set up your API key. The graphics will be processed server side and will be posted on the internet, but there is a way to avoid it.
Google Trends history
trends.google.com
GitHub pull requests history
datascience.com/trends
Machine Learning.
8. SciKit-Learn (Commits: 21793, Contributors: 842)
Scikits are additional packages of SciPy Stack designed for specific functionalities like image processing and machine learning facilitation. In the regard of the latter, one of the most prominent of these packages is scikit-learn. The package is built on the top of SciPy and makes heavy use of its math operations.
The scikit-learn exposes a concise and consistent interface to the common machine learning algorithms, making it simple to bring ML into production systems. The library combines quality code and good documentation, ease of use and high performance and is de-facto industry standard for machine learning with Python.
Deep Learning — Keras / TensorFlow / Theano
In the regard of Deep Learning, one of the most prominent and convenient libraries for Python in this field is Keras, which can function either on top of TensorFlow or Theano. Let’s reveal some details about all of them.
9.Theano. (Commits: 25870, Contributors: 300)
Firstly, let’s talk about Theano.
Theano is a Python package that defines multi-dimensional arrays similar to NumPy, along with math operations and expressions. The library is compiled, making it run efficiently on all architectures. Originally developed by the Machine Learning group of Université de Montréal, it is primarily used for the needs of Machine Learning.
The important thing to note is that Theano tightly integrates with NumPy on low-level of its operations. The library also optimizes the use of GPU and CPU, making the performance of data-intensive computation even faster.
Efficiency and stability tweaks allow for much more precise results with even very small values, for example, computation of log(1+x) will give cognizant results for even smallest values of x.
10. TensorFlow. (Commits: 16785, Contributors: 795)
Coming from developers at Google, it is an open-source library of data flow graphs computations, which are sharpened for Machine Learning. It was designed to meet the high-demand requirements of Google environment for training Neural Networks and is a successor of DistBelief, a Machine Learning system, based on Neural Networks. However, TensorFlow isn’t strictly for scientific use in border’s of Google — it is general enough to use it in a variety of real-world application.
The key feature of TensorFlow is their multi-layered nodes system that enables quick training of artificial neural networks on large datasets. This powers Google’s voice recognition and object identification from pictures.
11. Keras. (Commits: 3519, Contributors: 428)
And finally, let’s look at the Keras. It is an open-source library for building Neural Networks at a high-level of the interface, and it is written in Python. It is minimalistic and straightforward with high-level of extensibility. It uses Theano or TensorFlow as its backends, but Microsoft makes its efforts now to integrate CNTK (Microsoft’s Cognitive Toolkit) as a new back-end.
The minimalistic approach in design aimed at fast and easy experimentation through the building of compact systems.
Keras is really eased to get started with and keep going with quick prototyping. It is written in pure Python and high-level in its nature. It is highly modular and extendable. Notwithstanding its ease, simplicity, and high-level orientation, Keras is still deep and powerful enough for serious modeling.
The general idea of Keras is based on layers, and everything else is built around them. Data is prepared in tensors, the first layer is responsible for input of tensors, the last layer is responsible for output, and the model is built in between.
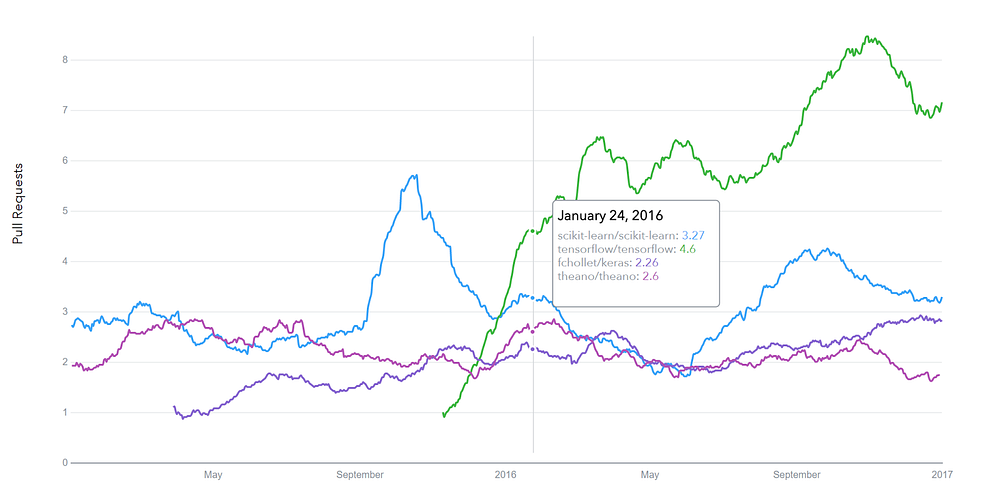
Google Trends history
trends.google.com
GitHub pull requests history
datascience.com/trends
Natural Language Processing.
12. NLTK (Commits: 12449, Contributors: 196)
The name of this suite of libraries stands for Natural Language Toolkit and, as the name implies, it used for common tasks of symbolic and statistical Natural Language Processing. NLTK was intended to facilitate teaching and research of NLP and the related fields (Linguistics, Cognitive Science Artificial Intelligence, etc.) and it is being used with a focus on this today.
The functionality of NLTK allows a lot of operations such as text tagging, classification, and tokenizing, name entities identification, building corpus tree that reveals inter and intra-sentence dependencies, stemming, semantic reasoning. All of the building blocks allow for building complex research systems for different tasks, for example, sentiment analytics, automatic summarization.
13. Gensim (Commits: 2878, Contributors: 179)
It is an open-source library for Python that implements tools for work with vector space modeling and topic modeling. The library designed to be efficient with large texts, not only in-memory processing is possible. The efficiency is achieved by the using of NumPy data structures and SciPy operations extensively. It is both efficient and easy to use.
Gensim is intended for use with raw and unstructured digital texts. Gensim implements algorithms such as hierarchical Dirichlet processes (HDP), latent semantic analysis (LSA) and latent Dirichlet allocation (LDA), as well as tf-idf, random projections, word2vec and document2vec facilitate examination of texts for recurring patterns of words in the set of documents (often referred as a corpus). All of the algorithms are unsupervised — no need for any arguments, the only input is corpus.
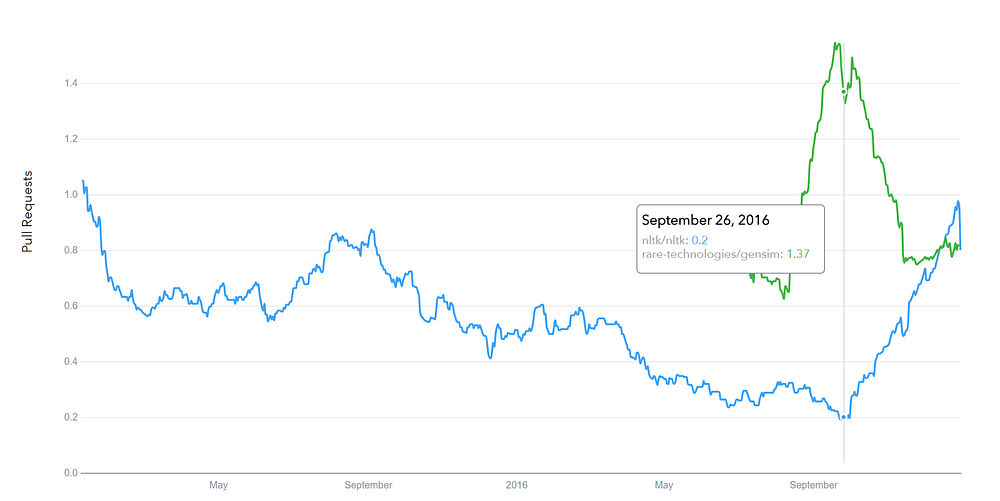
Google Trends history
trends.google.com
GitHub pull requests history
datascience.com/trends
Data Mining. Statistics.
14. Scrapy (Commits: 6325, Contributors: 243)
Scrapy is a library for making crawling programs, also known as spider bots, for retrieval of the structured data, such as contact info or URLs, from the web.
It is open-source and written in Python. It was originally designed strictly for scraping, as its name indicate, but it has evolved in the full-fledged framework with the ability to gather data from APIs and act as general-purpose crawlers.
The library follows famous Don’t Repeat Yourself in the interface design — it prompts its users to write the general, universal code that is going to be reusable, thus making building and scaling large crawlers.
The architecture of Scrapy is built around Spider class, which encapsulates the set of instruction that is followed by the crawler.
15. Statsmodels (Commits: 8960, Contributors: 119)
As you have probably guessed from the name, statsmodels is a library for Python that enables its users to conduct data exploration via the use of various methods of estimation of statistical models and performing statistical assertions and analysis.
Among many useful features are descriptive and result statistics via the use of linear regression models, generalized linear models, discrete choice models, robust linear models, time series analysis models, various estimators.
The library also provides extensive plotting functions that are designed specifically for the use in statistical analysis and tweaked for good performance with big data sets of statistical data.
Conclusions.
These are the libraries that are considered to be the top of the list by many data scientists and engineers and worth looking at them as well as at least familiarizing yourself with them.
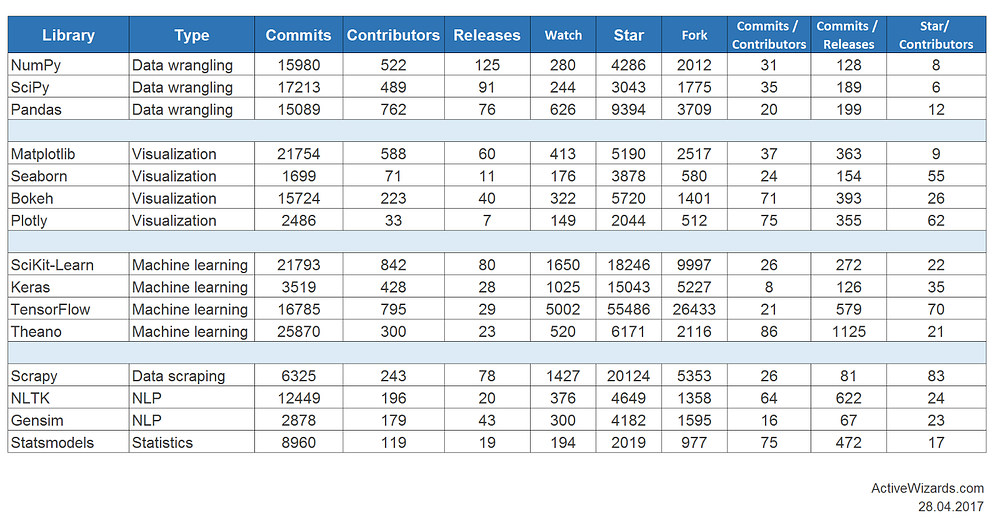
And here are the detailed stats of Github activities for each of those libraries:
Source: Google Spreadsheet
Of course, this is not the fully exhaustive list and there are many other libraries and frameworks that are also worthy and deserve proper attention for particular tasks. A great example is different packages of SciKit that focus on specific domains, like SciKit-Image for working with images.
So, if you have another useful library in mind, please let our readers know in the comments section.
Thank you very much for your attention.
Short version of article available here: https://activewizards.com/blog/top-15-libraries-for-data-science-in-python/
출처 : https://medium.com/activewizards-machine-learning-company/top-15-python-libraries-for-data-science-in-in-2017-ab61b4f9b4a7

