February 2020 (version 1.43)
Update 1.43.1: The update addresses these issues.
Welcome to the February 2020 release of Visual Studio Code. There are a number of updates in this version that we hope you will like, some of the key highlights include:
- Search Editors - Search and save your global search results in a full-sized editor.
- Draggable sash corners - Easily change the editor layout by dragging sash corners.
- Linux screen reader support - VS Code now supports the Orca screen reader.
- Minimap sizing options - New options to fit or fill the minimap vertical layout.
- Column selection mode - Column mode toggle lets you quickly select blocks of text.
- Display whitespace on selection - Render whitespace characters only in selected text.
- Convert to template string - Convert concatenations to JavaScript/TypeScript template strings.
- JS/TS Call Hierarchy view - Review all calls to or from a function and drill into callers of callers.
- Remote Development - Support for Windows and macOS SSH hosts, SSH connection sharing.
- Settings Sync preview - Settings Sync lets you share settings and keybindings across machines.
If you'd like to read these release notes online, go to Updates on code.visualstudio.com.
Insiders: Want to try new features as soon as possible? You can download the nightly Insiders build and try the latest updates as soon as they are available. And for the latest Visual Studio Code news, updates, and content, follow us on Twitter @code!
Workbench
Search Editors
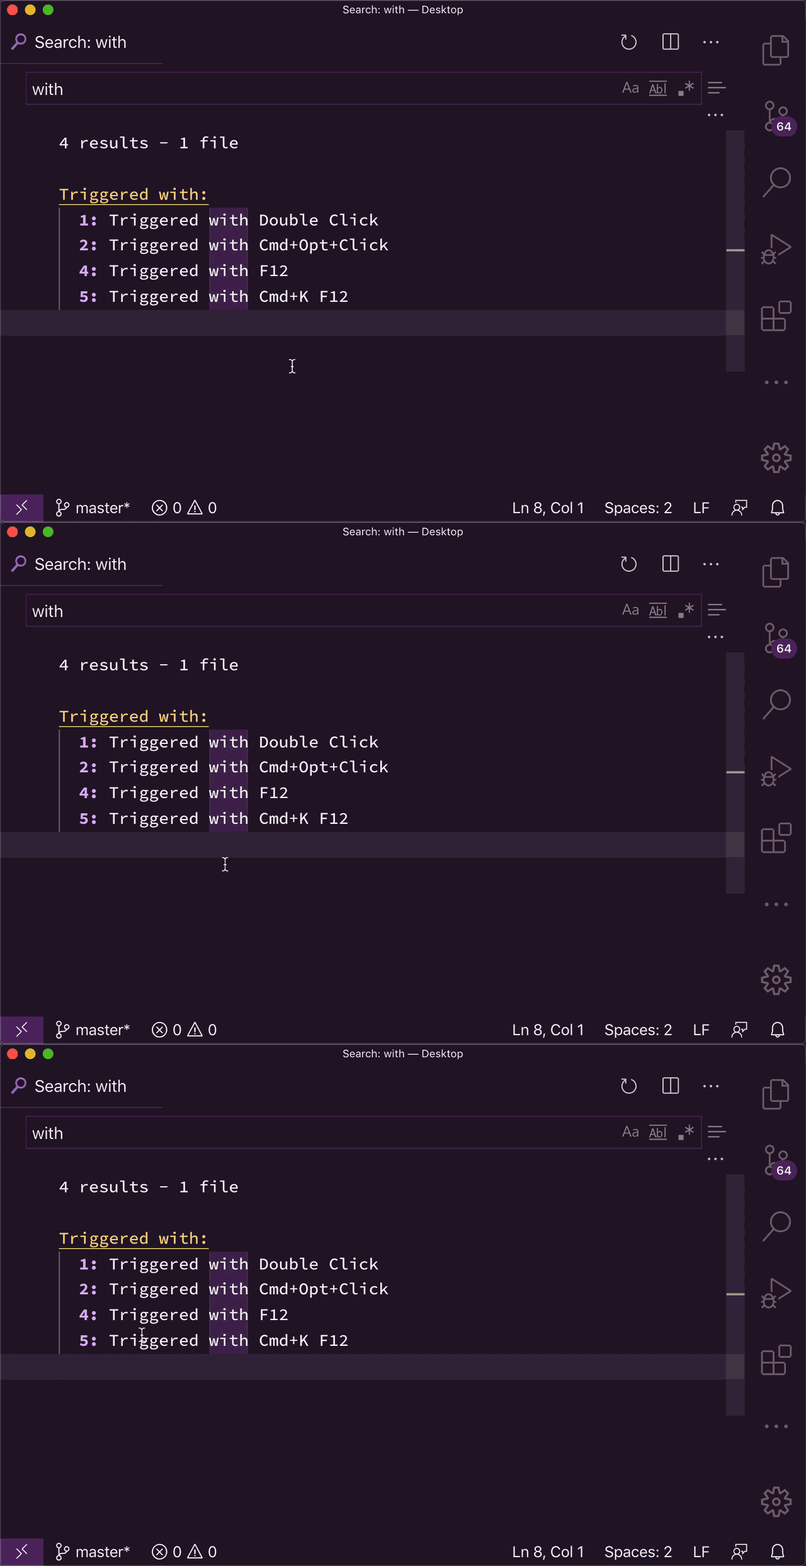
After a few iterations stabilizing on Insiders, we are shipping Search Editors, which let you view workspace search results in a full-sized editor, complete with syntax highlighting and optional lines of surrounding context. This has been a highly requested feature for some time.
Below is a search for the word 'SearchEditor' with two lines of text before and after the match for context:

Theme: A Touch of Lilac, Font: Hasklig
In a Search Editor, results can be navigated to using Go to Definition actions, such as F12 to open the source location in the current editor group, or Ctrl+K F12 to open the location in an editor to the side. Additionally, double-clicking can optionally open the source location, configurable with the search.searchEditor.doubleClickBehaviour setting.
You can open a new Search Editor with the Search Editor: Open New Search Editor command, or using the Open New Search Editorbutton at the top of the Search view. Alternatively, you can copy your existing results from a Search view over to a Search Editor with the Open in Editor link added to the top of the results tree, or the Search Editor: Open Results in Editor command.
Note: You can try out the experimental Search Editor: Apply Changes extension to synchronize edits you make in a Search Editor back to source files:
Draggable sash corners
Did you know you could resize two orthogonal sashes simultaneously by grabbing and dragging the intersection between them? This already worked for editor sashes, and now it also works in the edges between editors and views:

Theme: GitHub Sharp, Font: Fira Code
Notarized macOS builds
Visual Studio Code for macOS is now notarized by Apple, so you should no longer get the following dialog:
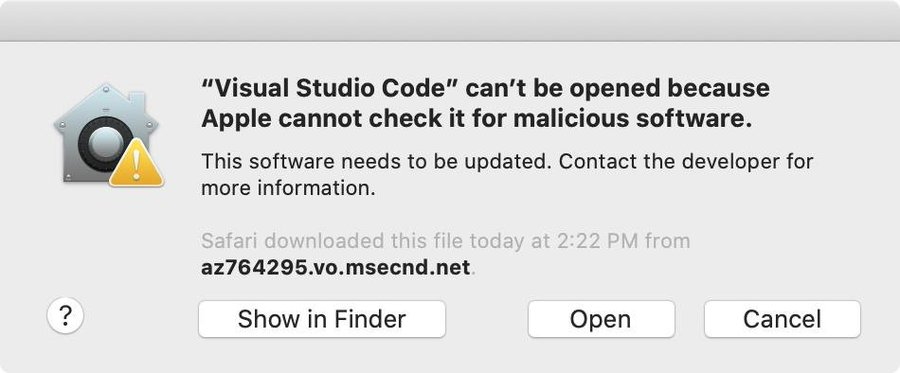
Read the investigation issue and Apple's developer documentation for more details.
Progress notifications
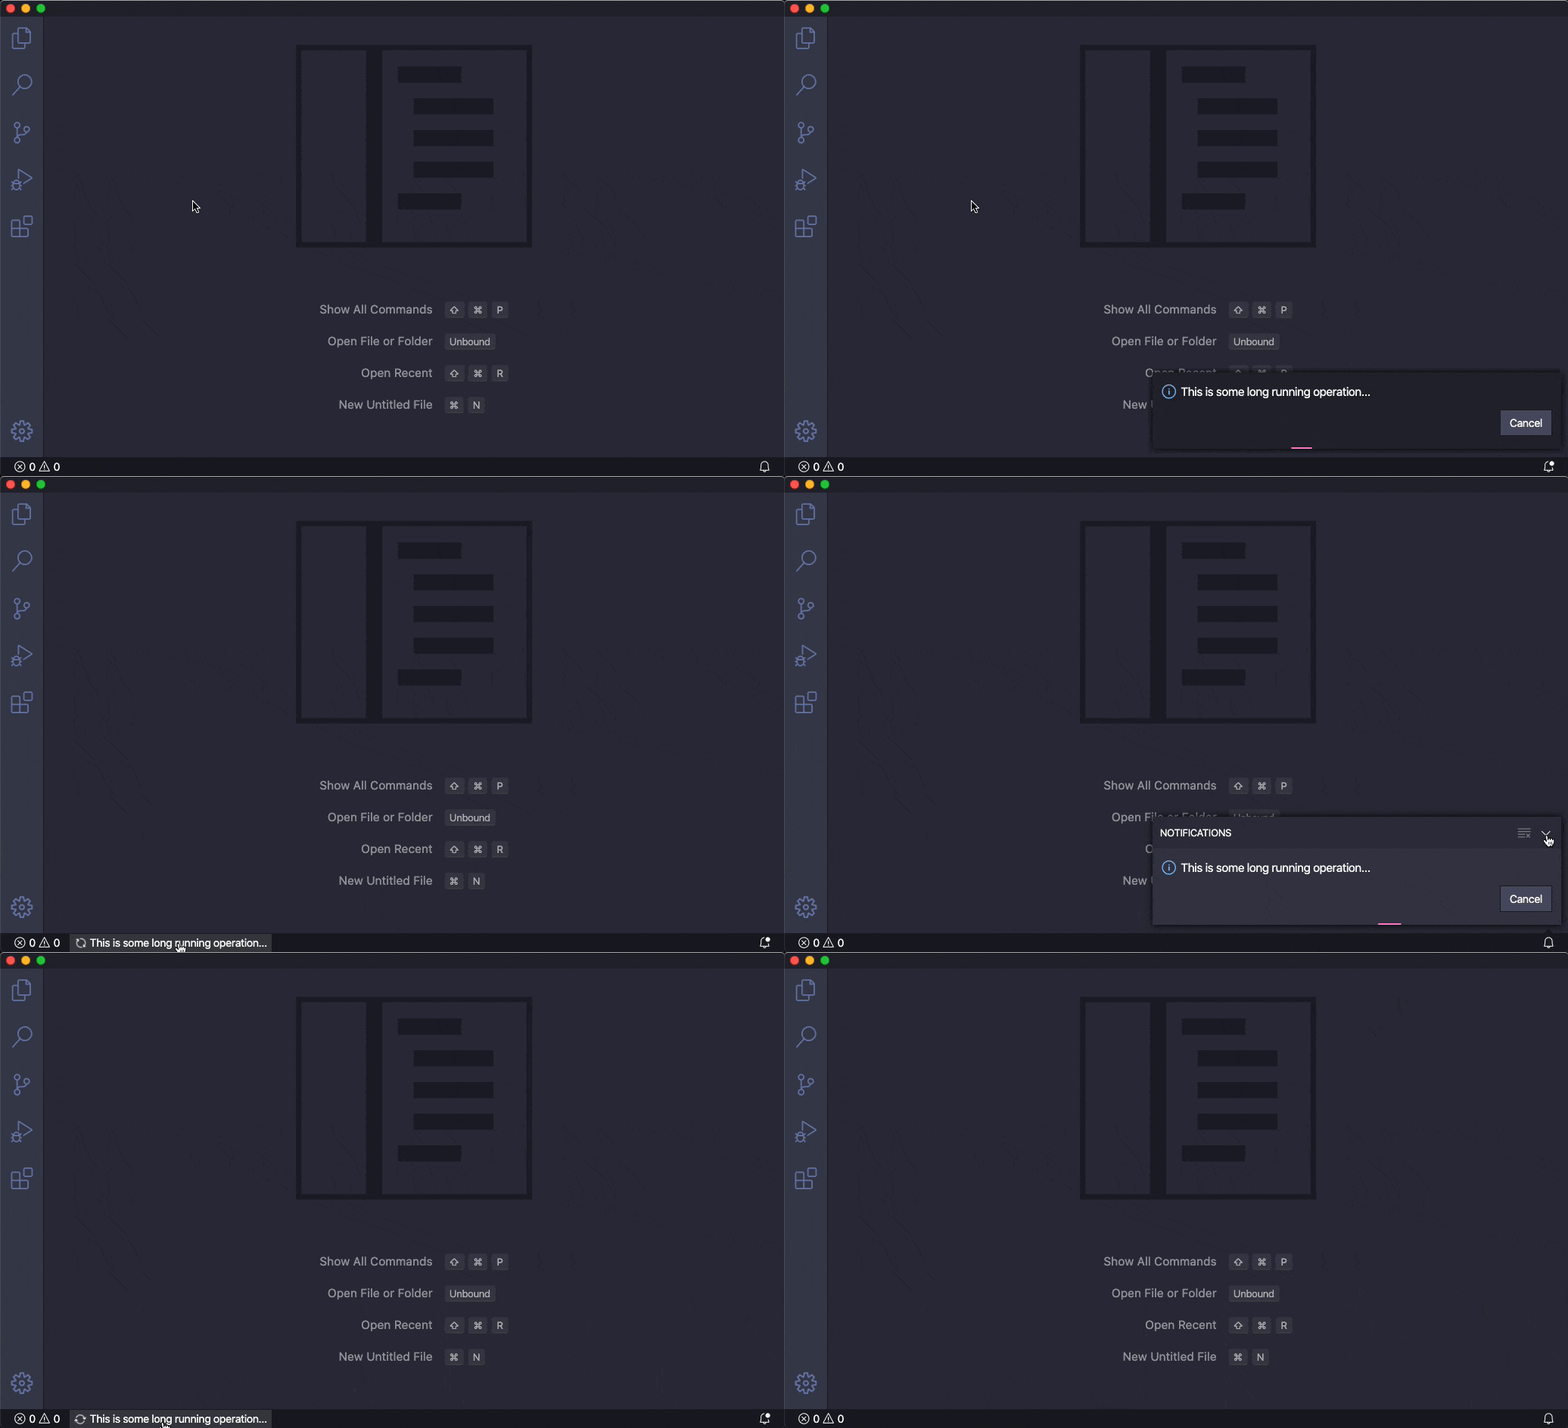
Notifications that indicate a long running operation behave slightly differently starting with this release:
- They do not provide a generic Close button anymore, as it gave the wrong impression about the operation being canceled or not. You can still press the unknown key to hide the notifications.
- The notifications indicate the progress of their operation in the Status bar, whenever the notification is hidden while the operation is still ongoing.
The later change helps you know that an operation is continuing to run in the background (such as a long running save operation) after you have dismissed the notification.
Below the operation is still running until the Cancel button is selected:
Theme: Dracula Official, Font: Fira Code
Untitled editors
A new setting workbench.editor.untitled.labelFormat lets you control whether untitled editors should use the file contents as the title or not. Possible values are content or name. Configure 'workbench.editor.untitled.labelFormat': 'name' for the previous behavior, where untitled editors would have a short title, such as Untitled-1.
When pasting text into an untitled editor, VS Code now automatically tries to detect the language mode from the first line of text. For example, pasting XML will set the XML mode automatically upon paste if the first line contains the typical XML header <?xml version="1.0" encoding="UTF-8"?>.
Open workspaces via application links
VS Code supports opening files through protocol links (for example vscode://file/<file-path>). In this milestone, we've expanded support to include opening folders or workspaces.
The syntax for folders or workspaces is the same as for files:
vscode://file/<path>
vscode-insiders://file/<path>
Welcome views
Welcome views are a new addition to the workbench, which allows a view to create starting experiences for users to create content or configure VS Code, whenever there isn't any meaningful content to be displayed. Some views have already adopted this infrastructure, for example the File Explorer, which will offer to open a folder or clone a Git repository to get you started.

Theme: GitHub Sharp
Source Control Welcome view
Thanks to the new Welcome view infrastructure, the Source Control view now provides a better experience for certain situations, in which it would otherwise appear empty. For example, it can now guide users to open folders or clone repositories or to install Git, when no installation is detected.

Theme: GitHub Sharp
Editor
Minimap size
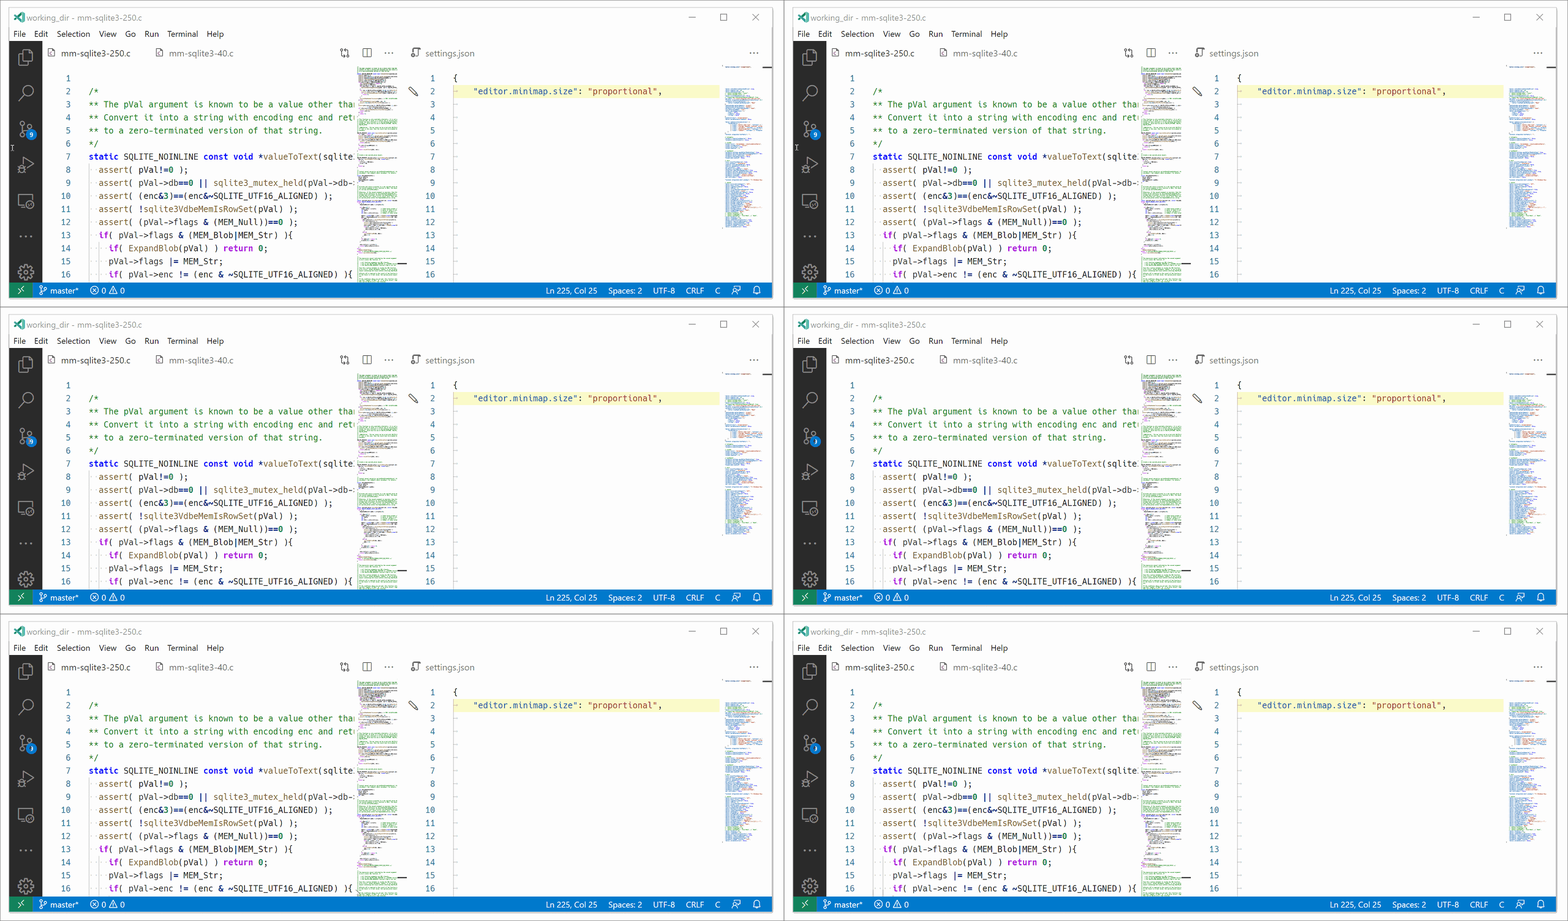
There is a new setting, editor.minimap.size, which controls how the minimap uses vertical space:
- When set to proportional (the default), each line gets a certain amount of vertical space in the minimap, depending on editor.minimap.scale. For example, on a high-DPI monitor, with a configured scale of 1 (the default), each line gets 4 px in the minimap. So for a file of 100 lines, the height of the lines rendered in the minimap is 400 px, and for a file of 1000 lines, it is 4000 px. That means that for large files, the minimap will also scroll, as the current file is scrolled.
- When set to fit, the height of the minimap is limited to never be larger than the editor height. So if a file has many lines, they will be sampled and only a subset will be rendered in the minimap, such that there is no need for the minimap to scroll.
- When set to fill, the height of the minimap is always the editor height. For large files, this is also achieved by sampling lines, but for small files, this is achieved by reserving more vertical space for each line (stretching the lines).
Here the size is changed from proportional to fit, and then in a smaller file, from fit to fill:
Minimap background and slider colors
There are now new colors for customizing the minimap and its slider. One of the new colors is minimap.background and when the color is defined to be transparent (lowering the #RRGGBBAA Alpha channel), the minimap will be rendered transparently:

{
"workbench.colorCustomizations": {
"minimap.background": "#00000055"
}
}
Column Selection mode
There is a new global toggle, accessible via the Selection > Column Selection Mode menu item. Once this mode is entered, as indicated in the Status bar, the mouse gestures and the arrow keys will create a column selection:
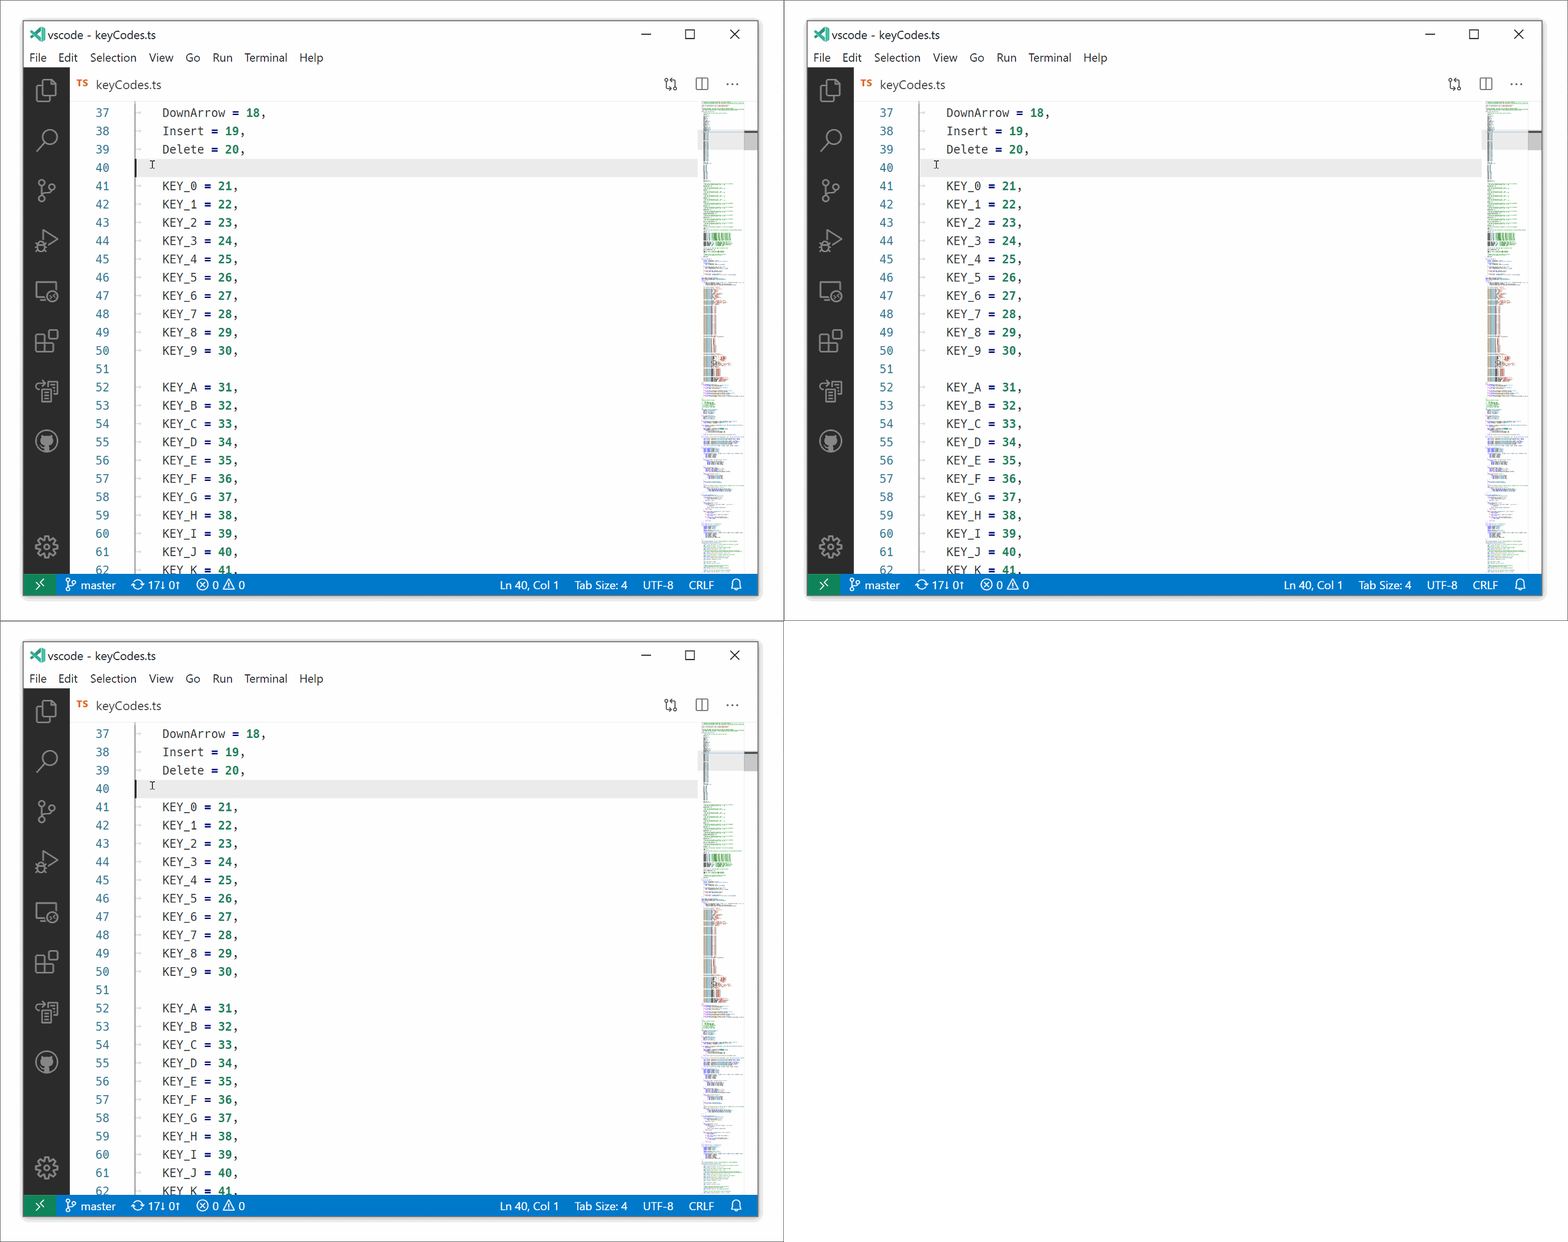
You can also disable Column Selection mode from the Status bar.
Render whitespace on selection
The default value of the editor.renderWhitespace setting has changed from none to selection. Whitespace characters will now be rendered on highlighted text by default.
Here the tab and space whitespace characters are displayed in the selected region:

Definition links in Peek
There is now more control over the behavior of the Go to Definition mouse gesture. By default, Go to Definition via mouse opens a separate editor but with the new setting editor.definitionLinkOpensInPeek as true, the gesture will open in a Peek view.
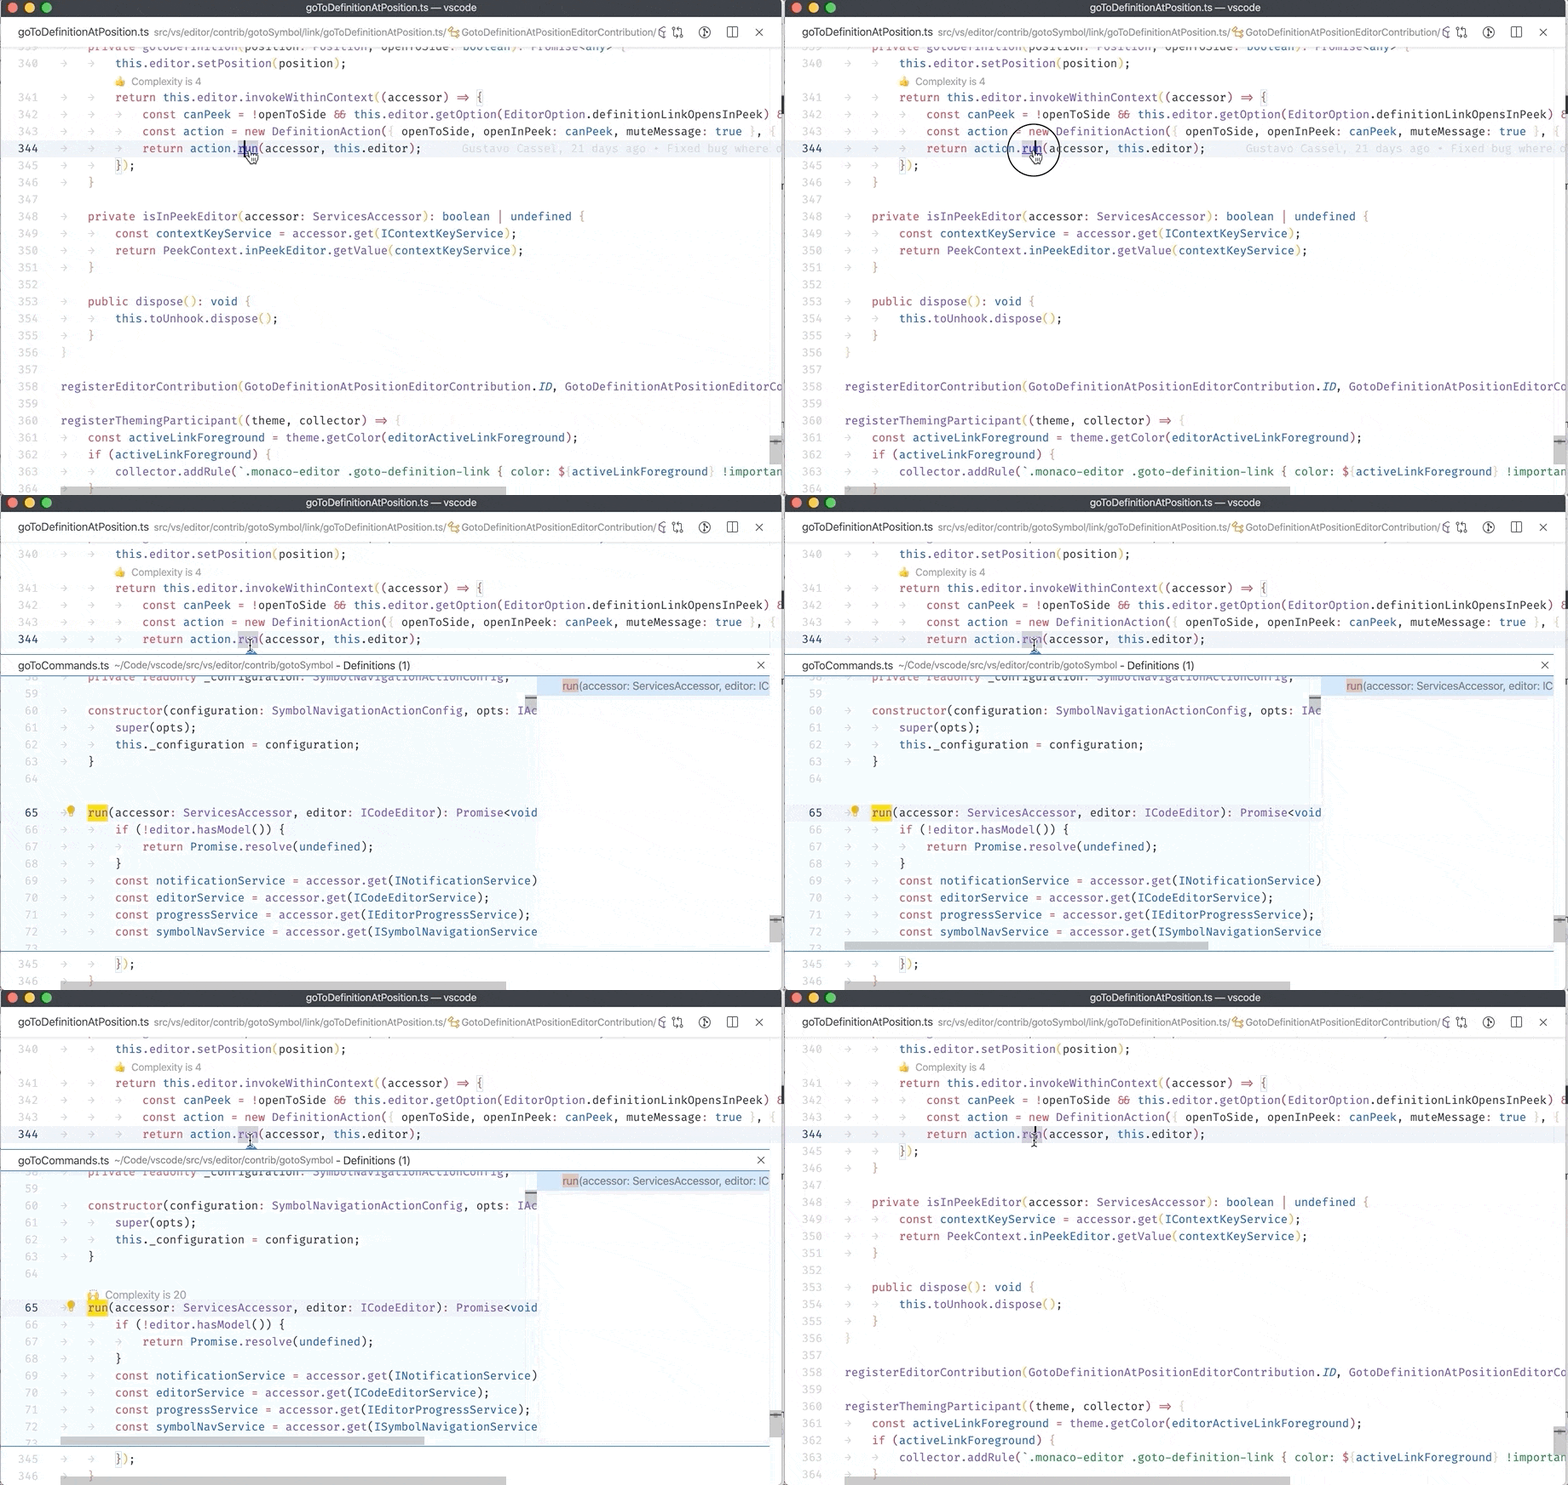
Unfold anywhere on a folded line
There's a new setting Editor: Unfold On Click After End of Line (editor.unfoldOnClickAfterEndOfLine) that controls what happens when you click in the empty space to the right of a folded line (after the ...). When set to true, you can click anywhere after the text on the folded line and not worry about exactly selecting the ellipses (...). By default, this option is off.

Undo textual edits across multiple files
When undoing a rename or a Code Action that affects multiple files, VS Code will now allow you to undo the change in all the affected files.
A prompt will be presented when undoing a cross-file edit:

Note: File operations, like renaming a file, are not yet supported. For example, renaming a class name in Java (where the file name gets renamed as well) is not yet supported with cross-file undo.
Multiple rulers with different colors
The existing editor.rulers setting has been extended to allow defining rulers that have custom colors. In the following screenshot, there is a magenta ruler at column 80 and a red one at column 90:

{
"editor.rulers": [
{ "column": 80, "color": "#ff00ff" },
{ "column": 90, "color": "#ff0000" }
]
}
Editor top and bottom padding
It is now possible to reserve whitespace (number of pixels) at the top or bottom of the editor using editor.padding.top and editor.padding.bottom.
Here is the editor with a top padding of 50 pixels:

{
"editor.padding.top": 50
}
Scrolling predominant axis
When trying to scroll vertically using a modern touchpad, it oftentimes happens that the file scrolls horizontally as well. There is now a new setting, editor.scrollPredominantAxis (which is set to true by default) which blocks "diagonal" scrolling. This forces scrolling gestures to be either vertical or horizontal (based on the highest absolute scroll delta), but never diagonal.
Shift+Insert on Linux
With 1.42, Shift+Insert was modified to paste from the selection clipboard. We received a lot of feedback that this was breaking existing muscle-memory and so we decided to roll back and have Shift+Insert paste from the regular clipboard, as before.
Accessibility
Linux screen reader support
With the help of the community, we have been working on making VS Code accessible on Linux with the Orca screen reader. Orca and Chromium are still actively working on screen reader support, so there are a couple of things needed in order to have this fully working:
- Make sure to use the latest version of Orca out of master. Instructions can be found in issue #91063.
- Make sure to have the setting "editor.accessibilitySupport": "on" in VS Code. You can do this using settings, or by running the Show Accessibility Help command and pressing Ctrl+E to turn on Screen Reader Optimized mode.
After enabling that setting, VS Code should work with the Orca screen reader.
Languages
TypeScript 3.8.3
VS Code now bundles TypeScript 3.8.3. This major update brings support for new language features including ECMAScript private fields, top-level await expressions, and the export * as ns syntax, along with many tooling features and improvements. The update also fixes a number of important bugs.
You can read more about TypeScript 3.8 on the TypeScript blog.
Convert to template string refactoring
You can use the new Convert to template string refactoring for JavaScript and TypeScript to quickly convert string concatenations to template strings:

Call hierarchy support for JavaScript and TypeScript
TypeScript 3.8 brings call hierarchy support in JavaScript and TypeScript.

Support for http(s) @link JSDoc inline tags
IntelliSense now renders JS Doc @link inline tags for http and https links. In the example image below, notice how the @link for lightbulb menu is rendered in the hover:

@link to URLs work for both JavaScript and TypeScript and are rendered as clickable links in hovers, suggestion details, and signature help.
TypeScript semantic highlighting
Semantic highlighting is now on by default for TypeScript and JavaScript. Semantic highlighting is provided by the TypeScript language server and goes on top of the syntax highlighting based on TextMate grammars. The default syntax (TextMate) highlighter classifies many tokens as variables and these are now resolved into namespaces, classes, parameters, and so on.
Semantic highlighting is controlled by the following setting:
"editor.semanticHighlighting.enabled": true
JSON schemas
When associating file names to schemas, you can now also use exclusion patterns. Exclusion patterns start with '!'. To match, at least one pattern needs to match and the last matching pattern must not be an exclusion pattern.
"json.schemas": [
{
"fileMatch": [
"/receipts/*.json",
"!/receipts/*.excluded.json"
],
"url": "./receipts.schema.json"
}
]
Debugging
"Run" more prominent in the UI
User studies revealed that new users have difficulties finding how to run their programs in VS Code. One reason is that the existing "Debugging" functionality is not something that they relate to "Running" a program. For that reason, we are making "Run" more prominent in the UI.
- The main menu Debug has become the Run menu.
- The Run and Debug view has become the Run view and the corresponding Activity Bar icon now shows a large "Play" icon with a small "bug" decoration.

Debug Console grouping
The VS Code Debug Console now supports output grouping. Debug extensions can indicate when Debug Console output should be grouped together under a common parent. For now, only the Mock Debug extension implements output grouping, but soon other debug extensions will follow - most notably the JavaScript debugger.
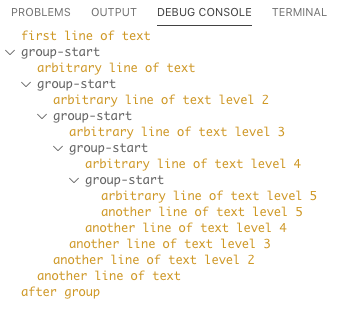
Disable Debug Console history suggestions
You can now turn off history suggestions in the Debug Console via the new debug.console.historySuggestions setting. By default, history suggestions are on.
Integrated Terminal
Unicode 11 support
The width of characters in the terminal now default to the Unicode 11 widths. What this means to most people is that emojis will be correctly showing up as wide characters.

Better Alt+Click to navigate prompt support
The terminal has a feature that lets you Alt+Click on a cell and the cursor will navigate to that cell. Historically when in a shell's prompt, this only worked on a single line, even if it was wrapped. This has been improved to work on a full wrapped line.
Theme: Sapphire
Note that this may not work correctly on Windows yet but recent changes to ConPTY should improve this in the future.
Tasks
Task Quick Pick updates
The task Quick Pick, shown when the Run Task command is executed, has been updated to show you which task providers are still running. If you don't need tasks from that provider, the Stop Detecting button will immediately show you the tasks that have been detected so far, so you don't have to wait for any slow task providers.
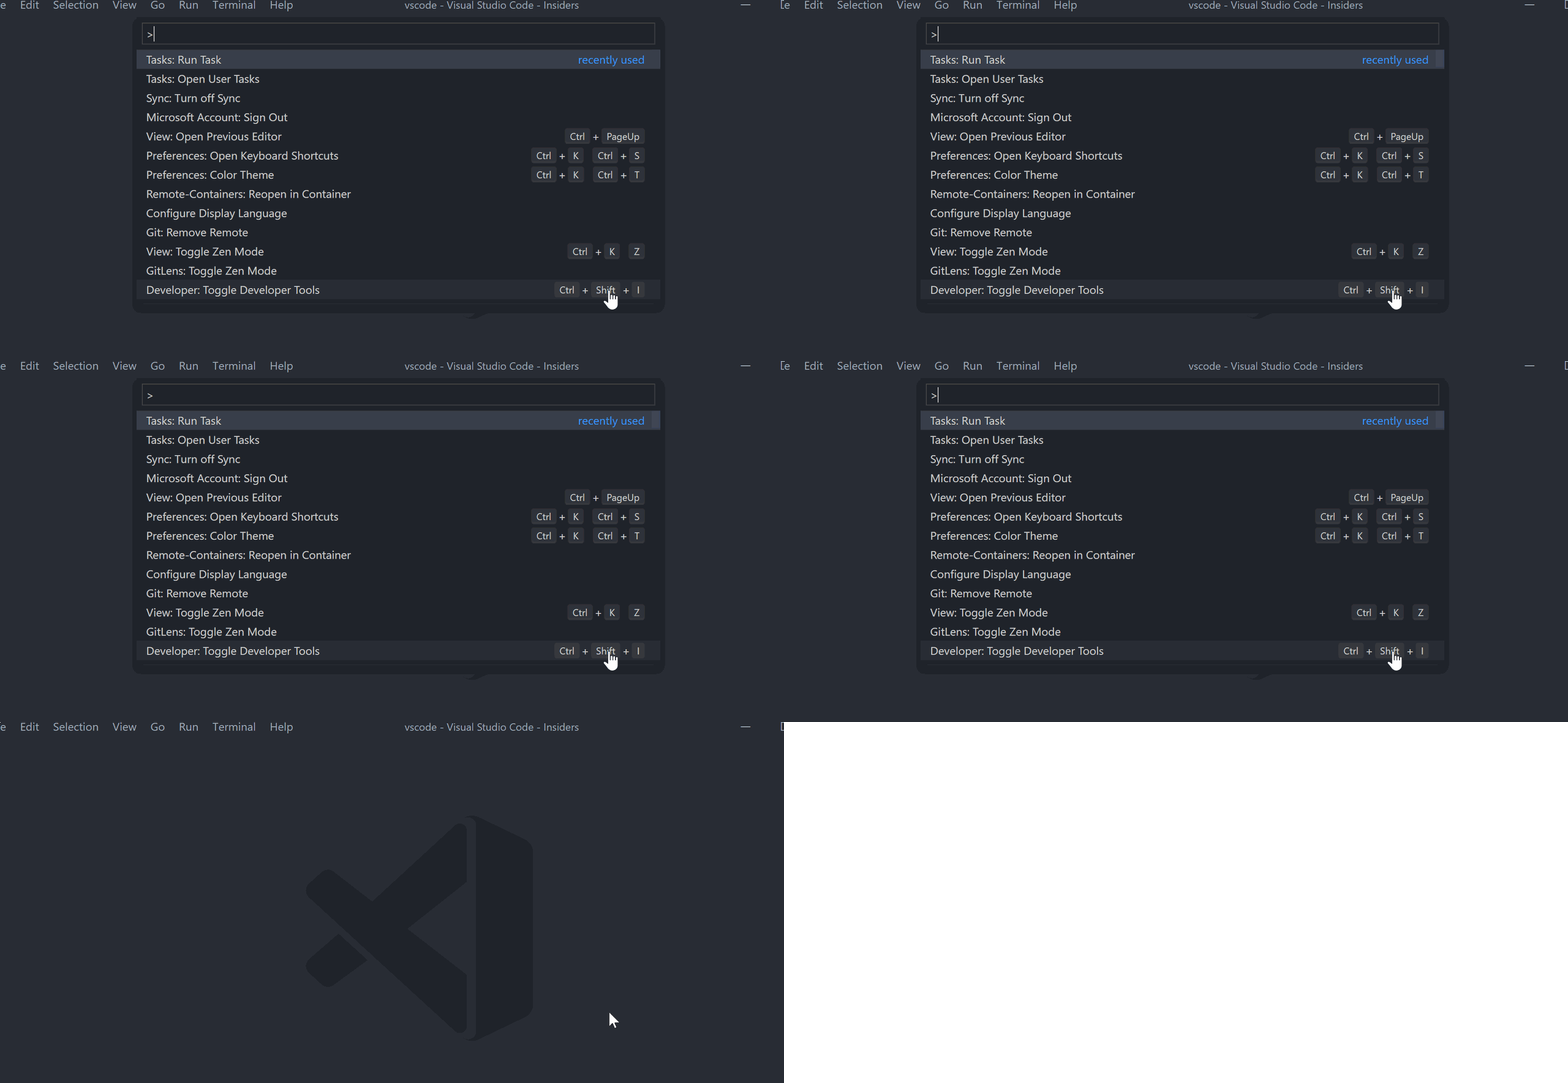
Theme: One Dark Pro, Font: Fira Code
Task instance limit
The tasks "runOptions" now includes an "instanceLimit", which specifies the number of instances of a task that are permitted. The default "instanceLimit" is 1.
promptString password input
The "promptString" user input type can have "password": true, which will cause the dropdown input box to obscure the typed content like a password.
Preview features
Preview features are not ready for release but are functional enough to use. We welcome your early feedback while they are under development.
Settings Sync
We have been working the last couple of months to support synchronizing VS Code settings, extensions, and keyboard shortcuts across machines (popular feature request #2743). In this milestone, we are happy to announce that this feature is ready for preview from our next 1.44.0 Insider release. You can now have your preferences synchronized in all your VS Code installs across all your machines. You can also bootstrap VS Code with your personal preferences on a fresh machine with minimal effort.
The following video demonstrates applying extensions and settings locally on a new machine:
Currently Settings, Keyboard Shortcuts, Extensions, and the Display Language are synchronized but we are planning to add more. You can review our list of proposed Setting Sync features.
Machine settings (with machine or machine-overridable scopes) are not synchronized by default. You can also add or remove settings in this list from the Settings editor or using the setting sync.ignoredSettings.

Theme: GitHub Sharp
Keyboard Shortcuts are synchronized per platform by default. If your keyboard shortcuts are platform-agnostic, you can synchronize them across platforms by disabling the setting sync.keybindingsPerPlatform.
All built-in and installed extensions are synchronized along with their global enablement state. You can skip synchronizing an extension, either from the Extensions view or using the setting sync.ignoredExtensions.
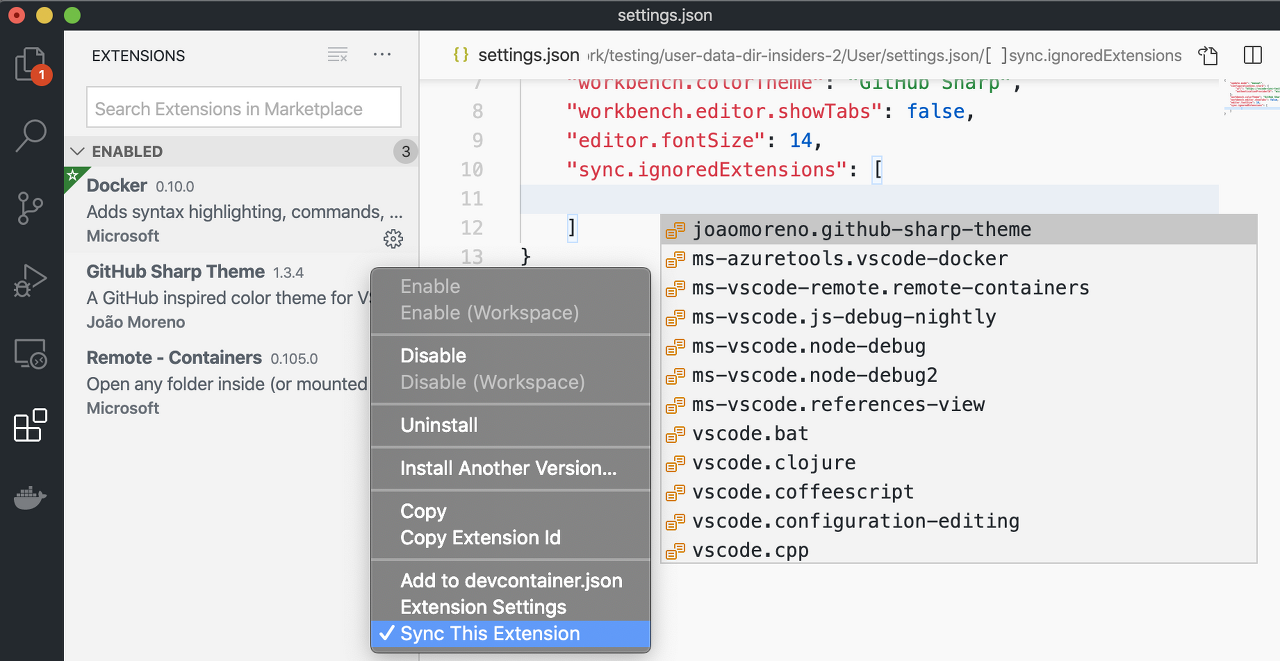
Theme: GitHub Sharp
Settings Sync supports detecting conflicts in settings and keybindings while synchronizing. Conflicts are shown using the diff editor with incoming (remote) changes on the left side and local changes on the right side. You can resolve the conflicts by editing in the right side editor and merge the changes using the actions provided in the editor.
Here the remote colorTheme setting value is chosen with the Accept Remote action:
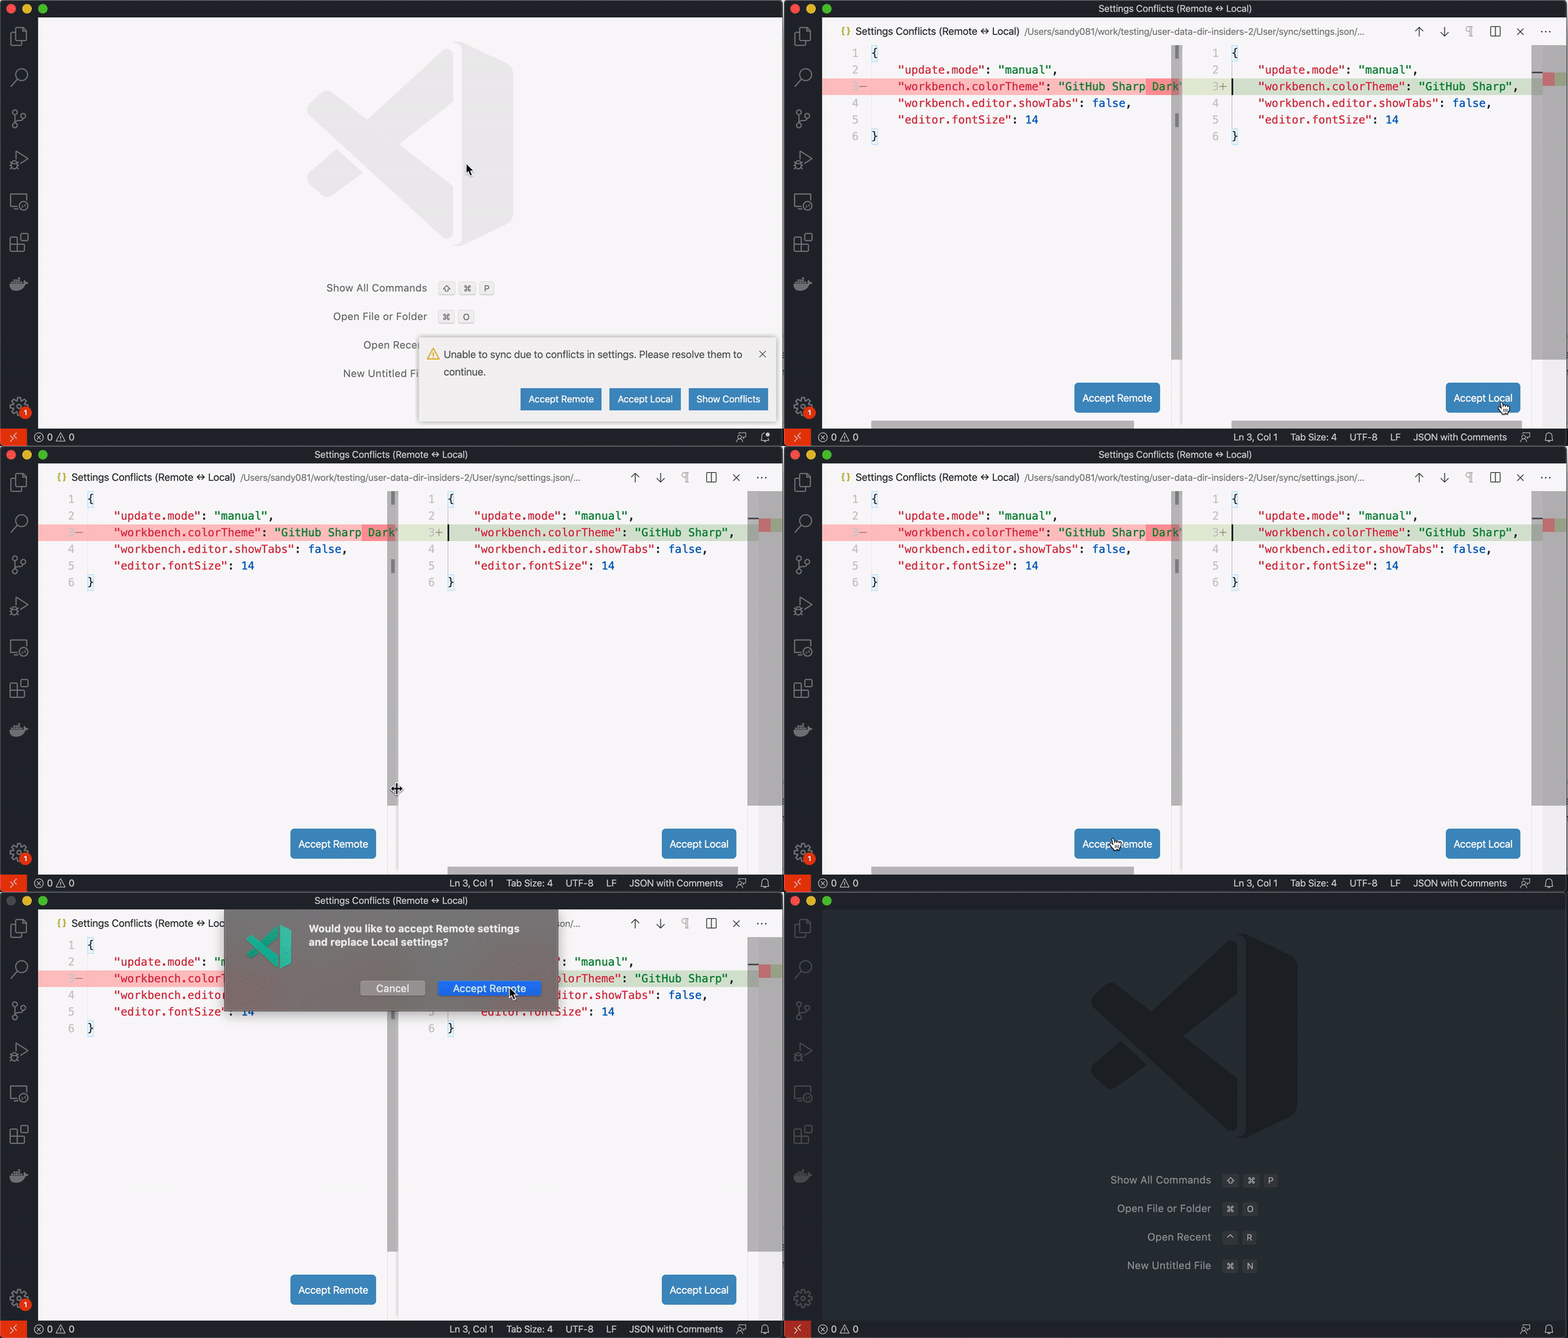
Themes: GitHub Sharp, GitHub Sharp Dark
Settings Sync activity can be monitored in the Log (Sync) output view. All local preferences are backed up for the last 30 days on disk whenever they are changed during synchronization. You can use the command Sync: Open Local Backups Folder to go the backups location and retrieve your old preferences.

Theme: GitHub Sharp
At any time, you can turn off synchronization, either on your current VS Code instance or on all your VS Code installs. When choosing to disable all synchronization, your data will be removed from the cloud.
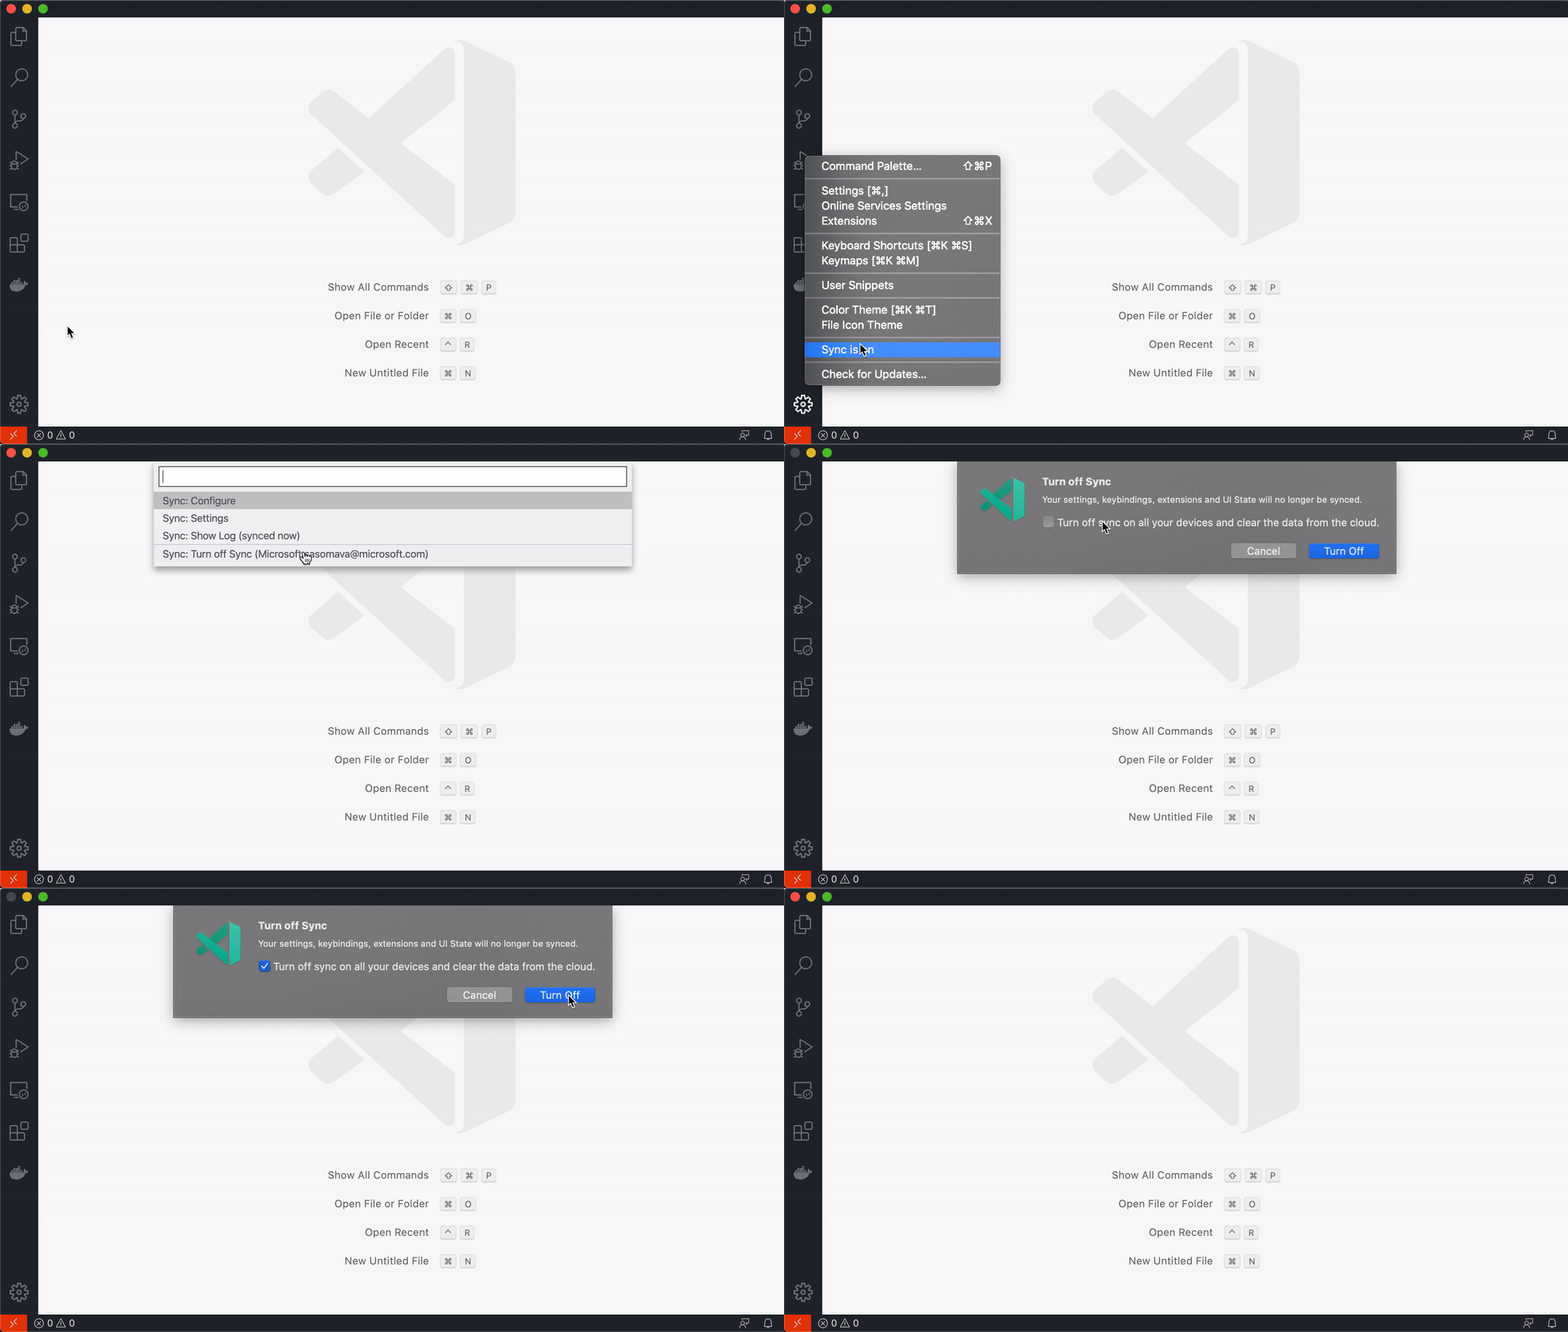
Note: Settings Sync uses a Microsoft account to store your VS Code preferences for synchronization and therefore you need an account to use this feature. For more information, refer to the Settings Sync documentation.
Timeline view
In this iteration, we've continued making progress on our new Timeline view. It's now enabled by default on the Insiders edition, and can be enabled on Stable via the following setting:
"timeline.showView": true
Below the Timeline view displays the Git commit history of a file:
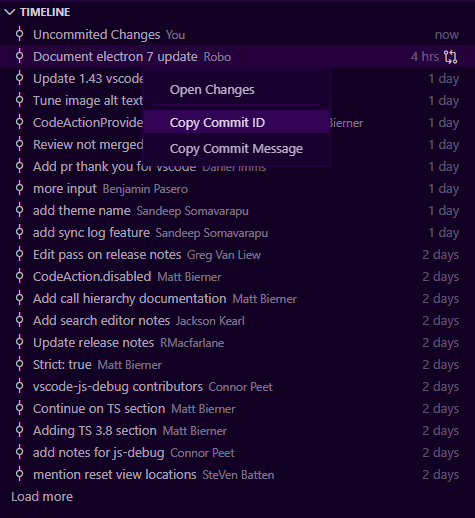
Theme: Dark Amethyst
We've now added paging support (via the Load more action shown above), and added a relative timestamp over on the right. Extensions can also contribute menu items to the Timeline view as well as to individual timeline items. In the screenshot above, the built-in Git extension is contributing the commands, Copy Commit ID and Copy Commit Message.
New JavaScript debugger
This month we've continued making progress on our new JavaScript debugger. It's installed by default on Insiders, and can be installed from the Marketplace in VS Code Stable. You can start using it with your existing launch configurations by enabling the debug.javascript.usePreview setting. Here are some new features we added this month:
Pretty printing
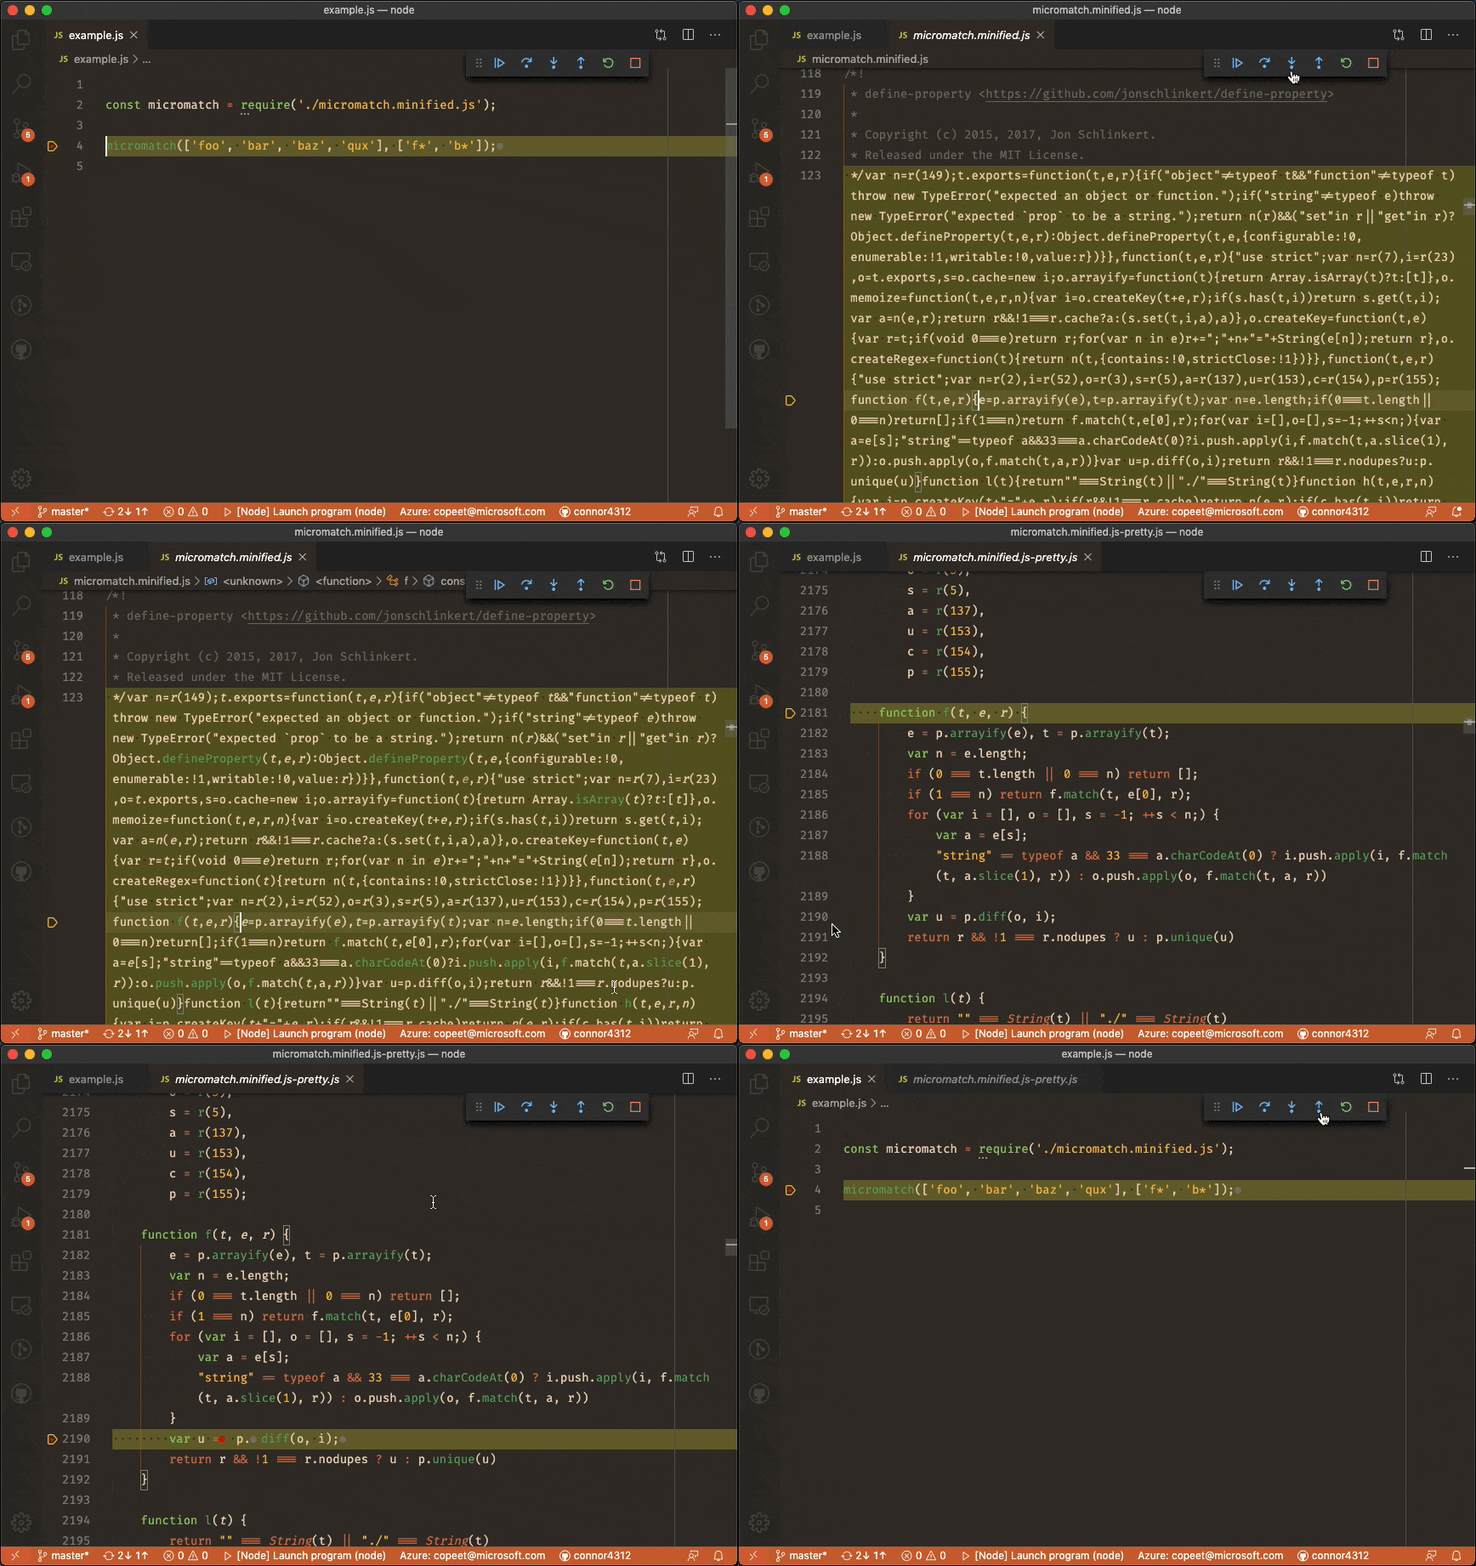
Theme: Earthsong, Font: Fira Code
The debugger can now pretty print files, especially useful when dealing with minified sources. It will show a prompt when you step into or open a file that looks minified, and you can also trigger pretty printing manually via the Debug: Pretty print for debuggingcommand.
You can turn off the suggestion prompt by selecting Never, or changing the setting debug.javascript.suggestPrettyPrintingto false.
Support for Microsoft Edge and WebView2
We now support launching the new Microsoft Edge browser, just change your debug type from chrome or pwa-chrome to pwa-msedge to try it out. It supports all the same configuration settings as chrome does.
With this comes support for the WebView2 control in desktop Windows applications. Check out our webview demo to learn how to set this up.
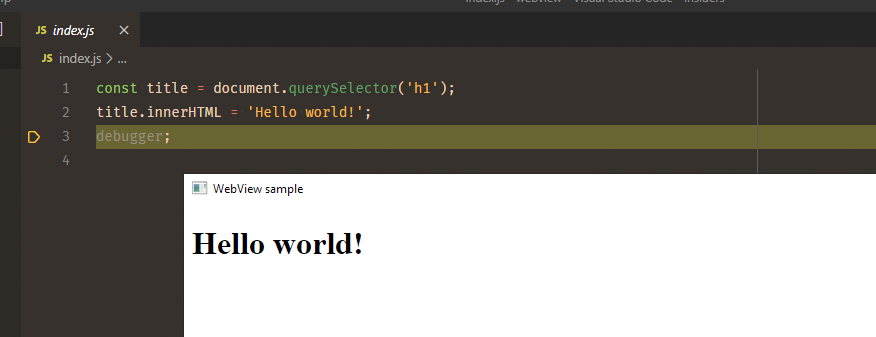
Remote Debugging
You can now debug browser source code from a remote workspace, such as VS Online or Remote SSH, in the new debugger. To set this up, port forward your web server (or a use a simple static web server), and then create a chrome or pwa-msedge launch configuration that points to the forwarded port.
For example:
{
"version": "0.2.0",
"configurations": [
{
"type": "pwa-msedge",
"request": "launch",
"name": "Debug my App",
"url": "http://localhost:5000", // <- debug an app forwarded on port 5000
}
]
}
When you launch the debugging session, a browser will open on your machine and you can debug like you normally would from VS Code.
More views are movable
Last release, VS Code gave you just a taste of relocating views to the Panel. In this release, this experience has been expanded to many more views. You can now move views such as the Debug/Run view or the new Timeline view. You can also move views into other views in the Side Bar. For example, perhaps you'd like to move the Open Editors view into the Source Control view. You can do all of this by dragging the views and dropping them in the desired location in the Activity Bar or Panel.
The animation below highlights moving the Open Editors view to a different view and then to the Panel:
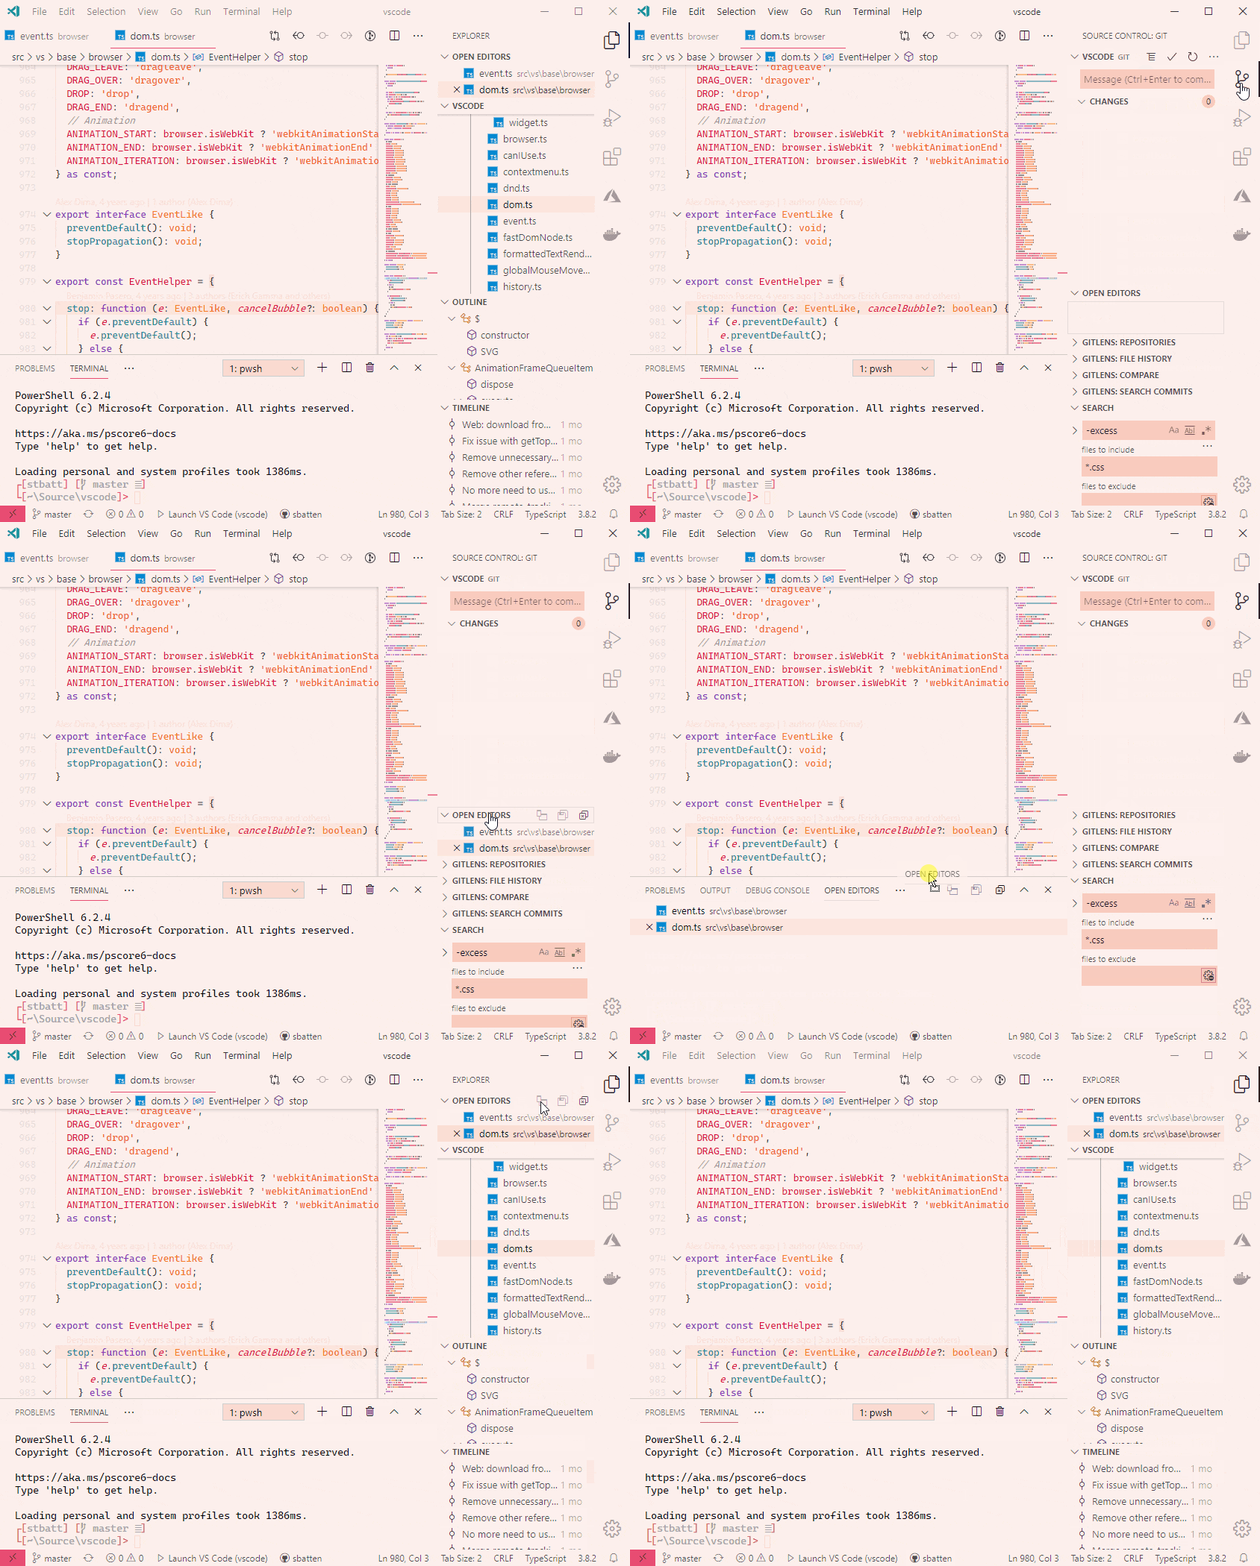
Theme: Horizon Bright, Font: Cascadia Code
We've also introduced a new command to make moving views easier with the keyboard: View: Move Focused View(workbench.action.moveFocusedView).
This is a preview feature, and so if you get into a state that you can't fix, there is a command to reset all views to their original locations: View: Reset View Locations (workbench.action.resetViewLocations).
Contributions to extensions
Remote Development
Work continues on the Remote Development extensions, which allow you to use a container, remote machine, or the Windows Subsystem for Linux (WSL) as a full-featured development environment.
Feature highlights in 1.43 include:
- Open remote workspaces via application links.
- Remote - SSH: Support for Windows and macOS SSH hosts.
- Remote - SSH: Connection sharing on by default.
- Remote - WSL: Check out the recent Using Docker in WSL 2 blog post.
You can learn about new extension features and bug fixes in the Remote Development release notes.
Vetur
The Vetur extension for Vue.js now includes better auto completion for template interpolation. You can find the changelog in the 0.24.0 release.
Extension authoring
Debugger Extension API
Debug Welcome view
As described in the Welcome View Content API section, the debug view is now open for Welcome View Content contributions. These additions can be used to guide beginning users to specific features that simplify running or debugging programs.
In order for the view to not become cluttered by too many Welcome View Content contributions, we suggest that individual contributions are only enabled for the current active language. To facilitate this, we have introduced a new context key debugStartLanguage, which is set to the last active editor language for which a debugger was used.
For example, if your debugger targets Python, you would contribute Welcome View Content only if debugStartLanguage == "python". In case your debugger targets multiple languages, you can use the OR operator (||) to combine multiple conditions.
New Debug Hover API
Today VS Code's debug hover uses a regular expression-based heuristic to find an expression under the mouse that the VS Code debugger evaluates and then shows the result in a hover. Since the regular expression is not configurable, not all languages are handled correctly (or they are not handled to the full extent possible). Issues #84044, #89603, and #89332 describe typical problems.
In this milestone, we've introduced new extension API to control the behavior of the debug hover.
An EvaluatableExpressionProvider can be registered for a language to provide an expression under the mouse that the VS Code debugger will evaluate against an active debug session.
Here is a simple example from the Mock debug sample that shows a (simple) implementation based on getWordRangeAtPositionAPI:
vscode.languages.registerEvaluatableExpressionProvider('markdown', {
provideEvaluatableExpression(document: vscode.TextDocument, position: vscode.Position):
vscode.ProviderResult<vscode.EvaluatableExpression> {
const wordRange = document.getWordRangeAtPosition(position);
if (wordRange) {
return new vscode.EvaluatableExpression(wordRange);
}
return undefined; // nothing evaluatable found under mouse
}
});
No longer escaping whitespace
The VS Code debugger UI no longer escapes or quotes any whitespace received from a debug extension or debug adapter. For example, all strings received in DAP Variables or as DAP Output events are shown in the UI as they are without modification.
This means that it is now up to the debug extension or debug adapter to decide if whitespace needs to be escaped before sending the data to VS Code. More details can be found in issue #73845.
CodeAction.disabled
With the CodeAction.disabled property, extension can now tell VS Code why a given CodeAction is not possible for the user's current selection. This is especially useful for refactorings.
Here's an example of using .disabled in our Code Action sample extension.
import * as vscode from 'vscode';
export class Emojizer implements vscode.CodeActionProvider {
public provideCodeActions(document: vscode.TextDocument, range: vscode.Range): vscode.CodeAction[] | undefined {
const action = new vscode.CodeAction(`Convert to ${emoji}`, vscode.CodeActionKind.Refactor.append('emojize'));
if (!this.isAtStartOfSmiley(document, range)) {
// Tell the user why our action is not available
action.disabled = { reason: 'Selection is not currently on a :)' };
return [action];
}
action.edit = new vscode.WorkspaceEdit();
action.edit.replace(document.uri, new vscode.Range(range.start, range.start.translate(0, 2)), '😀');
return action;
}
}
If the user tries to apply a disabled Code Action through a keybinding, VS Code will display the .disabled error message to the user:

In addition, to help with discoverability, disabled Code Actions are shown as faded in the Refactor and Source Action context menus:
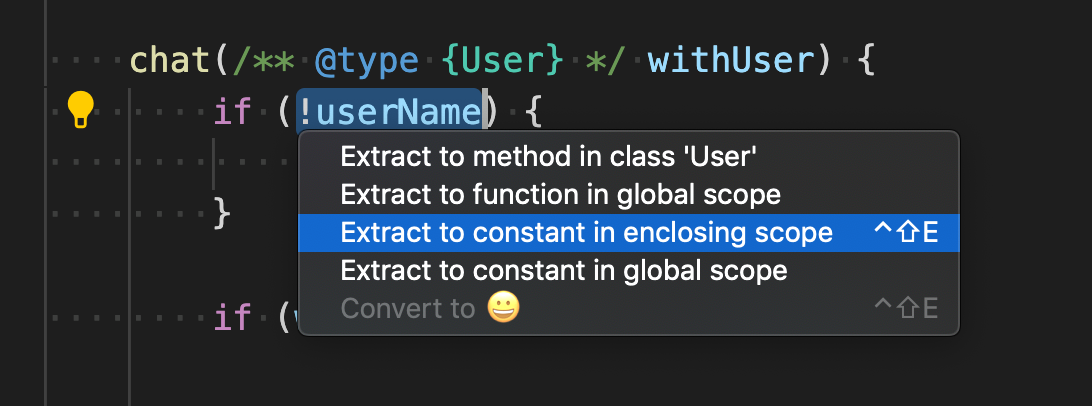
Note that disabled actions are not shown in the top-level lightbulb menu.
Terminal.exitStatus
Extensions can now determine whether terminals have exited and if they did, which exit code was used (if any).
window.onDidCloseTerminal(t => {
if (t.exitStatus && t.exitStatus.code) {
vscode.window.showInformationMessage(`Exit code: ${t.exitStatus.code}`);
}
});
Adding links to diagnostic errors
We have promoted the proposed diagnostic link API to Stable:
class Diagnostic {
...
/**
* A code or identifier for this diagnostic.
* Should be used for later processing, e.g. when providing [code actions](#CodeActionContext).
*/
code?: string | number | {
/**
* A code or identifier for this diagnostic.
* Should be used for later processing, e.g. when providing [code actions](#CodeActionContext).
*/
value: string | number;
/**
* A target URI to open with more information about the diagnostic error.
*/
target: Uri;
};
}
Workspace Edit Metadata
We have finalized the WorkspaceEditEntryMetadata API. It allows extension authors to classify the changes of a workspace edit, in particular if a change needs to be reviewed before being applied.
Debug Adapter Protocol
Support grouping in output events
An optional group attribute has been added to the output event in order to keep an output log organized by grouping related messages. Possible values for group are start and startCollapsed to open a group either expanded or collapsed, and end for closing a group.
Note: Starting with this release, VS Code supports this DAP enhancement.
Allow cursor placement via completion items
Optional selectionStart and selectionLength attributes have been added to the completion item. With these attributes, the client's current selection (or caret position) can be controlled after the completion text has been inserted.
Note: VS Code does not yet support this DAP enhancement. It is planned for the next release.
Proposal: Progress events
We made some progress on a proposal for adding progress events to the Debug Adapter Protocol. If you are interested, you can contribute to the discussion on this DAP feature request.
Language Server Protocol
Work started on version 3.16 of the Language Server Protocol.
Included in the new version is proposed support for:
- Insert / Replace edits for completion items.
- Structural codes on diagnostics (for example link support).
- Tag support for symbol information and document symbols.
Proposed extension APIs
Every milestone comes with new proposed APIs and extension authors can try them out. As always, we are keen on your feedback. This is what you have to do to try out a proposed API:
- You must use Insiders because proposed APIs change frequently.
- You must have this line in the package.json file of your extension: "enableProposedApi": true.
- Copy the latest version of the vscode.proposed.d.ts file into your project's source location.
Note that you cannot publish an extension that uses a proposed API. There may be breaking changes in the next release and we never want to break existing extensions.
Custom Editor API
We continued to work on the custom editor API proposal this iteration. Notable changes include:
- Renaming API methods to be shorter and more consistent.
- Simplifying creation of custom editors for text files by introducing CustomTextEditor. This custom editor uses VS Code's normal TextDocument as its data model, so that you don't have to implement save, backup, and other operations yourself. This also makes it easy to have live synchronization between a custom editor for a resource and a text editor for the same resource.
- Introduction of CustomDocument to store the model that a binary CustomEditor works with. There is one CustomDocumentper resource, but a user may open multiple custom editors on that resource.
Please continue to test and share feedback on our custom editor API proposal. Although the specifics of the API may still change, we believe the current proposal reflects what we are hoping to finalize soon.
CodeActionProviderMetadata.documentation
We've revised our previous proposal about standardizing how extensions contribute documentation for their Code Actions. With the updated proposal, documentation is now provided using a documentation property on the CodeActionProviderMetadata type.
For example, here's how our built-in JavaScript and TypeScript extension contributes documentation:
class TypeScriptRefactorProvider implements vscode.CodeActionProvider {
public static readonly metadata: vscode.CodeActionProviderMetadata = {
providedCodeActionKinds: [ vscode.CodeActionKind.Refactor ],
documentation: [
{
kind: vscode.CodeActionKind.Refactor,
// This command opens a webpage when executed
command: {
command: LearnMoreAboutRefactoringsCommand.id,
title: localize('refactor.documentation.title', "Learn more about JS/TS refactorings")
}
}
]
};
...
}
The documentation is rendered after the main Code Action list, whenever the user requests refactorings:

Issue #86788 tracks the status of the proposal.
Welcome View Content API
Certain views now support Welcome content contributed from extensions. Refer to the original issue for more information.
The views that have adopted this API are:
- explorer - File Explorer
- scm - Source Control
- debug - Run/Debug
As an example, here's a Welcome view content contribution from the Git extension to clone a repository, on the explorer Welcome view:

Theme: GitHub Sharp
OpenDialogOptions and SaveDialogOptions title
The OpenDialogOptions and SaveDialogOptions both have a proposed title property. Whether the title is shown is platform-dependent, but if the platform does show the title, it is shown above the Save or Open dialog. For example, the built-in command Workspaces: Save Workspace As... sets the title to Save Workspace.
Engineering
Electron 7.0 Update
In this milestone, we finished the exploration to bundle Electron 7 into VS Code. This is a major Electron release and comes with Chromium 78.0.3904.130 and Node.js 12.8.1.
For HDR displays
We are tracking an issue from Windows users with high dynamic range (HDR) displays in issue #88491, where VS Code looks dull and unusable. This is an issue with all Chromium-based applications on 78.0.3904.130 and the issue is fixed in more recent versions of Chromium 81. VS Code will get this fix once we upgrade to Electron 9 and there are technical reasons why the fix couldn't be backported to Chromium 78.
In the meantime, we have a temporary workaround for this issue:
- Open the Command Palette (Ctrl+Shift+P).
- Run the Preferences: Configure Runtime Arguments command.
- This command will open a argv.json file to configure runtime arguments. There might be some default arguments there already.
- Edit "disable-color-correct-rendering": true to "disable-color-correct-rendering": false.
- Restart VS Code.
Note: Do not edit this setting unless you are experiencing issues!
We added this default runtime argument so that we can override Chromium's default color correction to sRGB and instead use the display color space on macOS. Doing this avoids problems like issue #84154 but doesn't work for HDR displays.
"strict": true
When we first released VS Code, TypeScript was still a new and rapidly evolving language that was missing some of the useful type safety checks that you probably take for granted today, such as strict null checking. Over the past few years, the TypeScript team has introduced a number of options that make the TypeScript compiler more "strict". These strict options can catch many common programming mistakes and eliminate entire classes of errors. The benefits of strict mode are well documented, and we've long wanted to enable strict mode for the VS Code codebase. However doing so seemed like an almost impossible task, given that it would require fixing thousands of errors in the roughly half a million lines of source code that make up the core VS Code codebase.
Still, the value of strict mode was great enough that we decided it was worth working towards, even if it would take us some time to get there. So over the past two years, we've been incrementally updating our code base to be strict mode compliant. We did all this work incrementally and directly in our development branch so that every strict mode related fix made our codebase a little bit safer for everyone. Enabling strict null checks was probably the most complicated part of the process, and we documented how we accomplished this in a blog post.
This iteration, we finally finished enabling the last strict mode option: strictFunctionTypes. With this done, a rather anticlimactic commit enabled strict mode for our entire codebase!
Enabling strict mode was a long journey that everyone on the core VS Code team and many community members contributed to. However, by doing this work incrementally, we were able to benefit from all this hard work starting on day one. Going forward, strict mode should encourage coding best practices, make refactoring safer, and ultimately let us ship faster and with fewer bugs!
Improved CI build performance
VS Code uses Azure Pipelines for its continuous integration builds and we recently improved the build performance considerably. You can learn more about this in the Improving CI Build Times blog post.
Running tests against browsers
In this milestone, we enabled all of our tests (unit, integration, smoke) to run in browsers by leveraging the Playwright library, which gives us increased coverage on browsers such as Chrome, Firefox, and Safari. You can refer to our VS Code Tests README for how to run these tests.
Notable fixes
- 61491: SCM: Viewlet should improve "no repositories" messaging
- 74782: Investigate: macOS notarization
- 82828: autoReveal highlight filename where it is without always moving it to the middle in explorer
- 8641: macOS: Allow mouse buttons 4 and 5 to navigate history
- 87767: VSCode restart debugging not working anymore
- 88038: Do not pollute shell history with automatically executed debugger commands
- 89230: "Group" is read when editor is focused
- 89699: Go Back/Go Forward: preserve selections
- 89989: Web: allow to open a file into a new window
- 90075: Explorer: Support dangling symbolic links
- 90240: Line numbers invisible after Zen Mode toggled off
- 90876: List items should have role 'listitem'
- 91166: Alerts are too verbose when problems panel is open.
- 91238: Chords not working in integrated terminal
Thank you
Last but certainly not least, a big Thank You! to the following folks that helped to make VS Code even better:
Contributions to our issue tracking:
- John Murray (@gjsjohnmurray)
- Andrii Dieiev (@IllusionMH)
- Alexander (@usernamehw)
- ArturoDent (@ArturoDent)
- Gama11 (@Gama11)
Contributions to vscode:
- @alpalla: Fixes #32264 - Allow N instances of the same task PR #89872
- Baibhav Vatsa (@BaibhaVatsa): Removes redundant flags from tsconfig.base.json PR #91050
- Bailey Herbert (@baileyherbert)
- @bepvte: Rename "Contributions" to "Feature Contributions" PR #89842
- @bolinfest
- Brett Cannon (@brettcannon): Fix plurality in command docs PR #89959
- Dor Mesica (@dormesica): Fix run active file in terminal not wrapping with quotes PR #90847
- Evan Krause (@evangrayk): Fix undo/redo broken in non-editor webviews PR #89961
- Ian MacFarlane (@eyeino): Clarify language when creating new git branch PR #90160
- John Murray (@gjsjohnmurray)
- lipgloss (@gloss-water): Theming: add workbench configuration option for minimap opacity PR #58324
- Michael Gubik (@gubikmic): Scroll predominant axis only (prevents scroll drift) PR #70047
- Gustavo Cassel (@GustavoASC)
- Developed setting which controls whether the definition link opens element in the peek widget. PR #89884
- Fixed bug where one could open 'peek' inside 'peek' on definition link PR #90109
- Improved documentation of 'title' parameter on VSCode Proposed API PR #91633
- Exposed Open/Save dialog title on public VSCode Proposed API PR #90493
- @Helloimbob: Autodetect csh script as shellscript PR #90960
- Jean Pierre (@jeanp413)
- Properly reset editor.lineNumbers after disabling zen mode PR #90822
- Enable to open diagnostic link from problems panel with keyboard PR #91035
- Address feedback for reset editor.lineNumbers after disabling zen mode PR #90910
- Fixes explorer new folder inputbox duplicates parent folder children when toggling collapse state PR #90419
- Jonas Littorin (@jlittorin): Added a password attribute to input variable of type "promptString". PR #90482
- John Blackbourn (@johnbillion): Treat .envrc files as Shell scripts PR #90825
- Josh Goldberg (@JoshuaKGoldberg): Docs typo: missing ` in insertSpaces PR #90374
- @LadyCailin: Move indent right one when the highlighted line is a scope start/end PR #77762
- Maik Riechert (@letmaik): Docs: fix package.json field name "extensionDependency" PR #90103
- Gordey (@lgordey): Settings UI: Add separator for sync setting PR #91461
- Alex SK (@lxsk): fix #21849: Minimap: Show Full Document PR #74425
- Dan (@mallardduck): Add support for multiple rulers with different colors PR #88453
- Rasmus (@neonsea): Avoid polluting shell history with debugger commands PR #88041
- @nrayburn-tech
- Przemek Adamczewski (@padamczewski): fix: multi cursor copy line n times (#40646) PR #52645
- Peter Shinners (@PeterShinners): Grammar fix for task.autoDetect description PR #90117
- PM Extra (@PMExtra): Fix a small bug of JsonValidation PR #91237
- Ron Buckton (@rbuckton): Fix off-by-one typo to improve display of files in TS call hierarchy PR #89822
- Robert Rossmann (@robertrossmann): Style diff editor's scrollable viewport just like any other scrollbar PR #89660
- Oğuzhan Eroğlu (@rohanrhu): Added remembering end key state behaviour PR #88664
- Michael Scovetta (@scovetta): Fix #90555 (resetLocal() doesn't do anything) PR #90556
- Sergio Schvezov (@sergiusens): Snap fixes PR #91182
- Matthew Spencer (@sirmspencer): Add new action to close side bar PR #90404
- Konstantin Solomatov (@solomatov): Fix link handing in extension pseudoterminals PR #88458
- 태재영 (@TroyTae): Supporting triple dots for front-matter end PR #90122
- Victor Gomes (@vhpgomes): smartSelect fix PR #90736
- Waldemar Kornewald (@wkornewald): Reveal closer to top (center body, not signature) PR #80727
- @zhengjiaqi: editor action run support params PR #87677
- Jiayue. Zhang (@zjysdhr): Fix #88294 Add commitData in commit interface PR #89005
Contributions to vscode-eslint:
- Yosuke Ota (@ota-meshi): Add to support new eslint suggestions API PR #814
- Krasimir Nedelchev (@kaykayehnn): Fix typo PR #900
Contributions to language-server-protocol:
- Lars Hvam (@larshp) specification 3.15, fix typo PR #912
- Maxim Reznik (@reznikmm):
- Fix specification-3-15.md markdown formatting PR #913
- Drop extra foldingRangeProvider definition in 3.15 PR #914
- Drop extra ExecuteCommandOptions def in 3.15 PR #915
- Replace ts with typescript in 3.15 markdown PR #916
- Drop duplicated TextDocumentRegistrationOptions PR #917
- Add selection range related capabilities to 3.15 PR #918
- Add workspaceFolders/configuration/window to 3.15 PR #930
- Christian Tietze (@DivineDominion) fix typo PR #921
- Kun Ren (@renkun-ken) Fix typo PR #922
Contributions to vscode-js-debug:
- SantoJambit (@SantoJambit): Only get root level scripts property for codelens PR #351
Contributions to vscode-languageserver-node:
- @Razzeee Fix typo PR #574
- Remy Suen (@rcjsuen): Fix typo in name of semantic tokens file PR #583
Contributions to vscode-css-languageservice:
- Jorge del Casar (@jorgecasar): Add support for parsing @apply rules in SCSS PR #194
- Denis Malinochkin (@mrmlnc): Ability to use suggest participants for SCSS/Less mixins PR #201
- Will Bender (@Ragnoroct): Fix scss autocompletion after a ruleset PR #188
Contributions to vscode-vsce:
- Robert Holt (@rjmholt): Add --noGitHubIssueLinking to stop issue link expansion in package step PR #424
Contributions to localization:
There are over 800 Cloud + AI Localization community members using the Microsoft Localization Community Platform (MLCP), with over about 170 active contributors to Visual Studio Code. We appreciate your contributions, either by providing new translations, voting on translations, or suggesting process improvements.
Here is a snapshot of contributors. For details about the project including the contributor name list, visit the project site at https://aka.ms/vscodeloc.
- Chinese (Simplified, China) Yizhi Gu, Tingting Yi, Charles Dong, Justin Liu, 斌 项, ick, paul cheung, CHEN Shihuan, 普鲁文, 张锐, Zhiqiang Li, Joel Yang.
- Chinese (Traditional, Taiwan) Yi-Jyun Pan, 高民 林.
- Danish (Denmark) Lasse Stilvang.
- Dutch (Netherlands) Koen Williame.
- English (United Kingdom) Martin Littlecott, Henry Dearn, carlos baltazar.
- Finnish (Finland) Feetu Nyrhinen.
- French (France) Thierry DEMAN-BARCELÒ, Antoine Griffard, Rodolphe NOEL, Younes ZOBAIRI.
- German (Germany) Philip Kneifeld, Raphael Höser, nick rauch.
- Hindi (India) KRISHNA TANDON, Alish Vagadiya.
- Hungarian (Hungary) Levente Borbély.
- Indonesian (Indonesia) Eriawan Kusumawardhono, Riwut Libinuko.
- Italian (Italy) Luigi Bruno.
- Japanese (Japan) TENMYO Masakazu, Koichi Makino.
- Korean (Korea) 강 성원, Hongju, 관우 정.
- Latvian (Latvia) Andris Vilde, Atis Straujums.
- Polish (Poland) Makabeus Orban, Mariusz Wachowski.
- Portuguese (Brazil) Marcondes Alexandre, Arthur Lima, Marcelo Fernandes, Roberto Fonseca, Yuri Dantas, Luiz Gustavo Nunes, Thiago Takehana.
- Portuguese(Portugal) Diogo Barros.
- Romanian (Romania) LaServici.
- Russian (Russia) Andrey Veselov, Vadim Svitkin, Дмитрий Кирьянов.
- Spanish (Spain, International Sort) Ricardo Estrada Rdez, Alvaro Enrique Ruano.
- Tamil (India) Vijay Rajasekar, Selvakumarasamy G, Pandidurai R.
- Turkish (Turkey) Mehmet Yönügül.
- Vietnamese (Vietnam) Hiếu Nguyễn, Van-Tien Hoang, Vương.
'Computer' 카테고리의 다른 글
| 데이터 폭증 시대에 발맞추는 저장장치 기술 (0) | 2020.04.10 |
|---|---|
| 'NoneType' object has no attribute 'find_all' (0) | 2020.03.21 |
| Visualisation & Visualization- 차이점??? (0) | 2020.03.15 |
| Visualize vs Visualise - What's the difference? (0) | 2020.03.14 |
| [정보] 복사 붙혀넣기 발명한 사람이 누군지 아시나요? (0) | 2020.02.24 |

